SCIAMACHY Spectral Throughput Monitoring
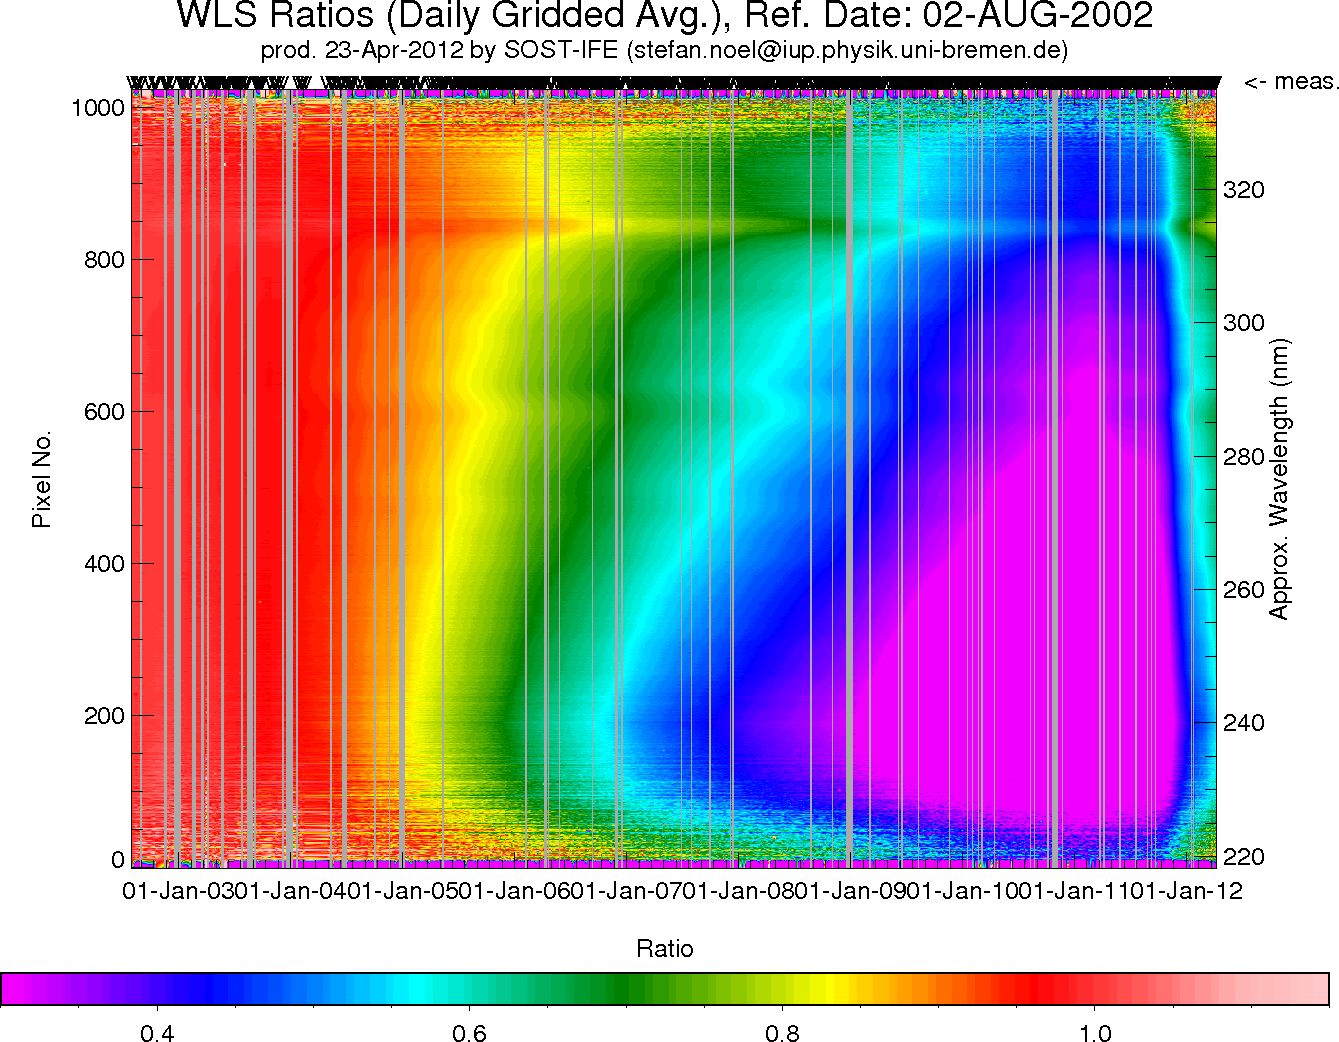
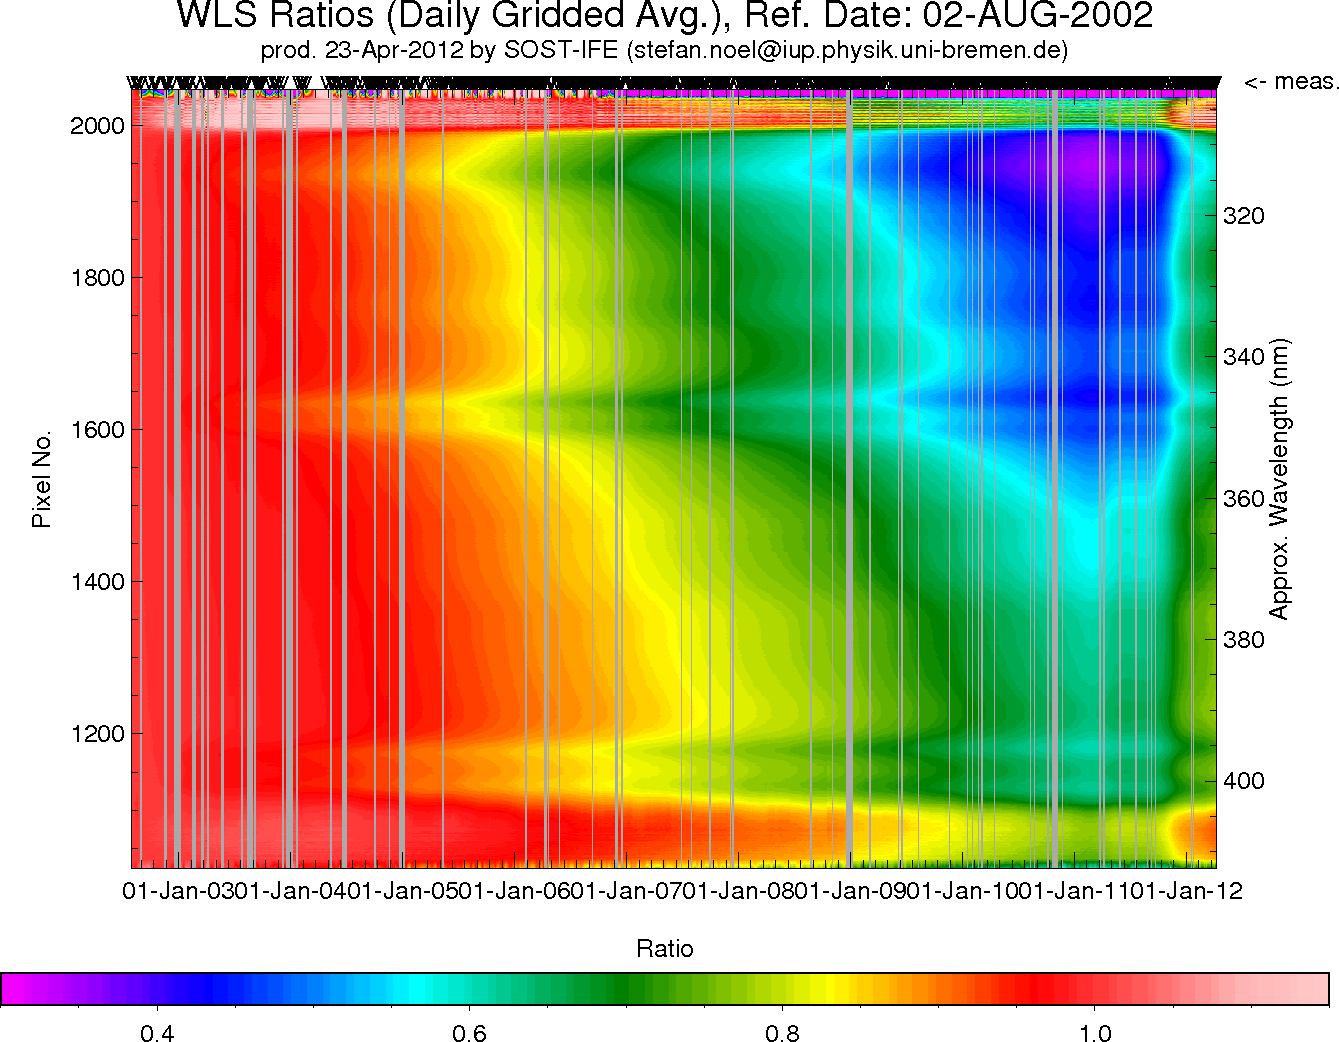
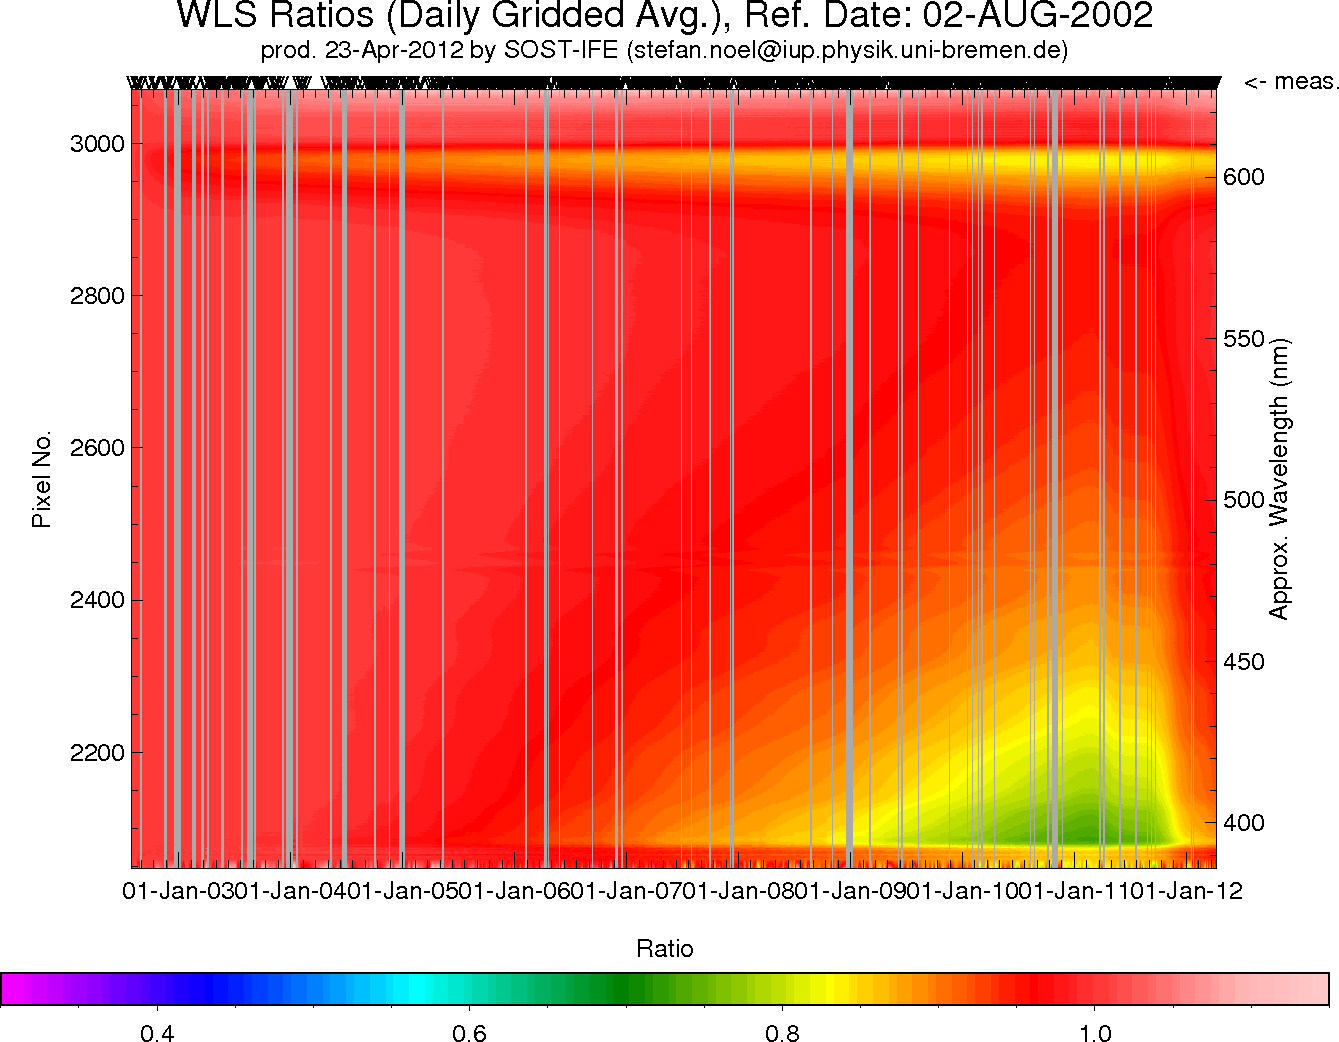
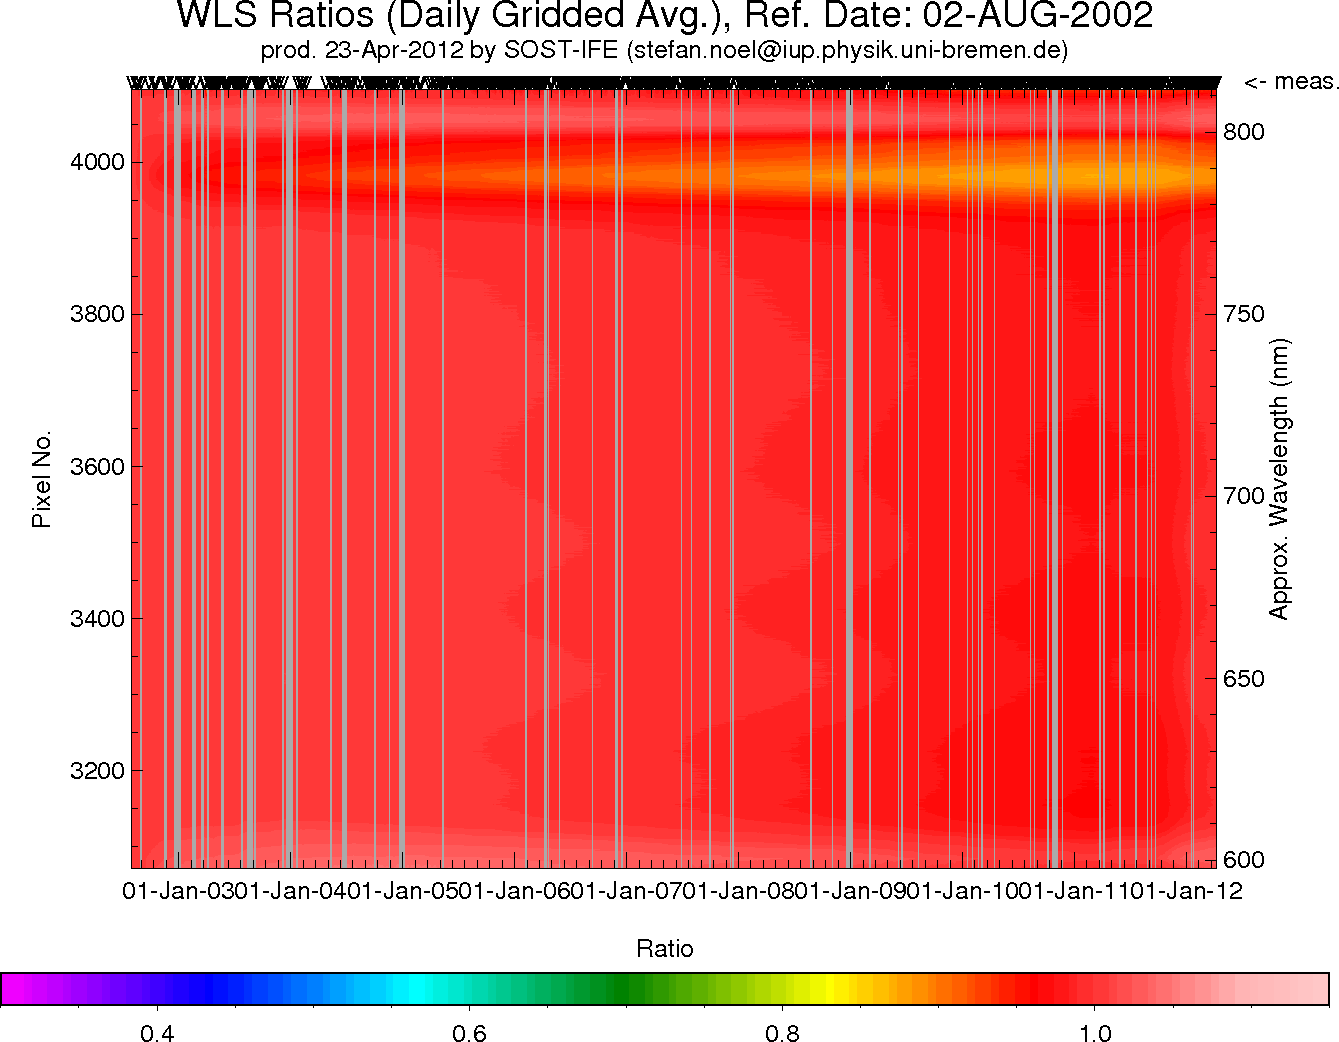
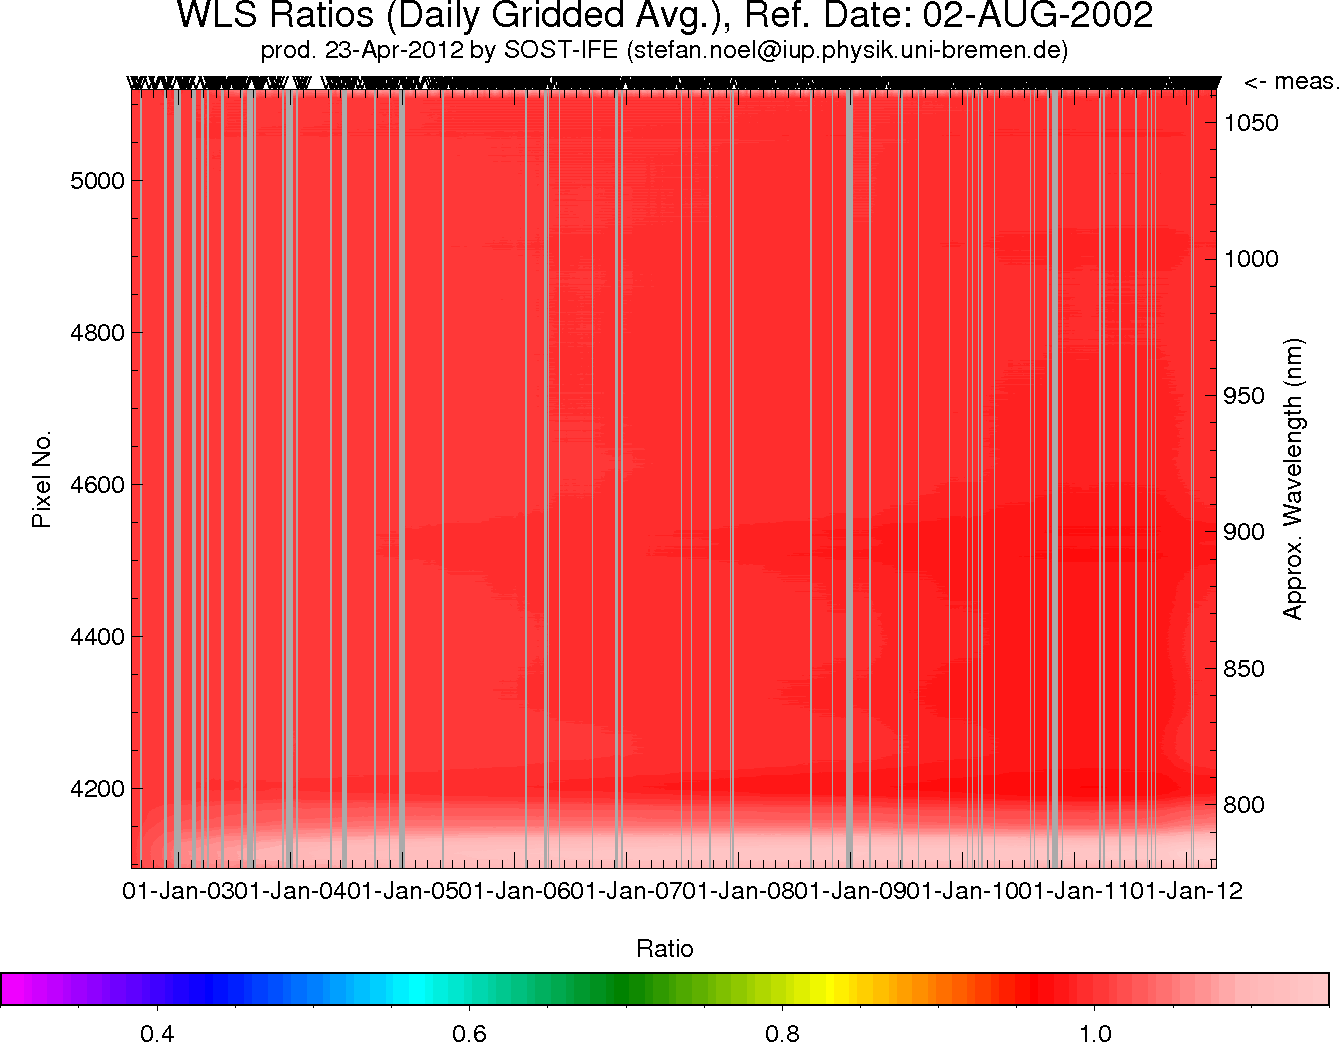
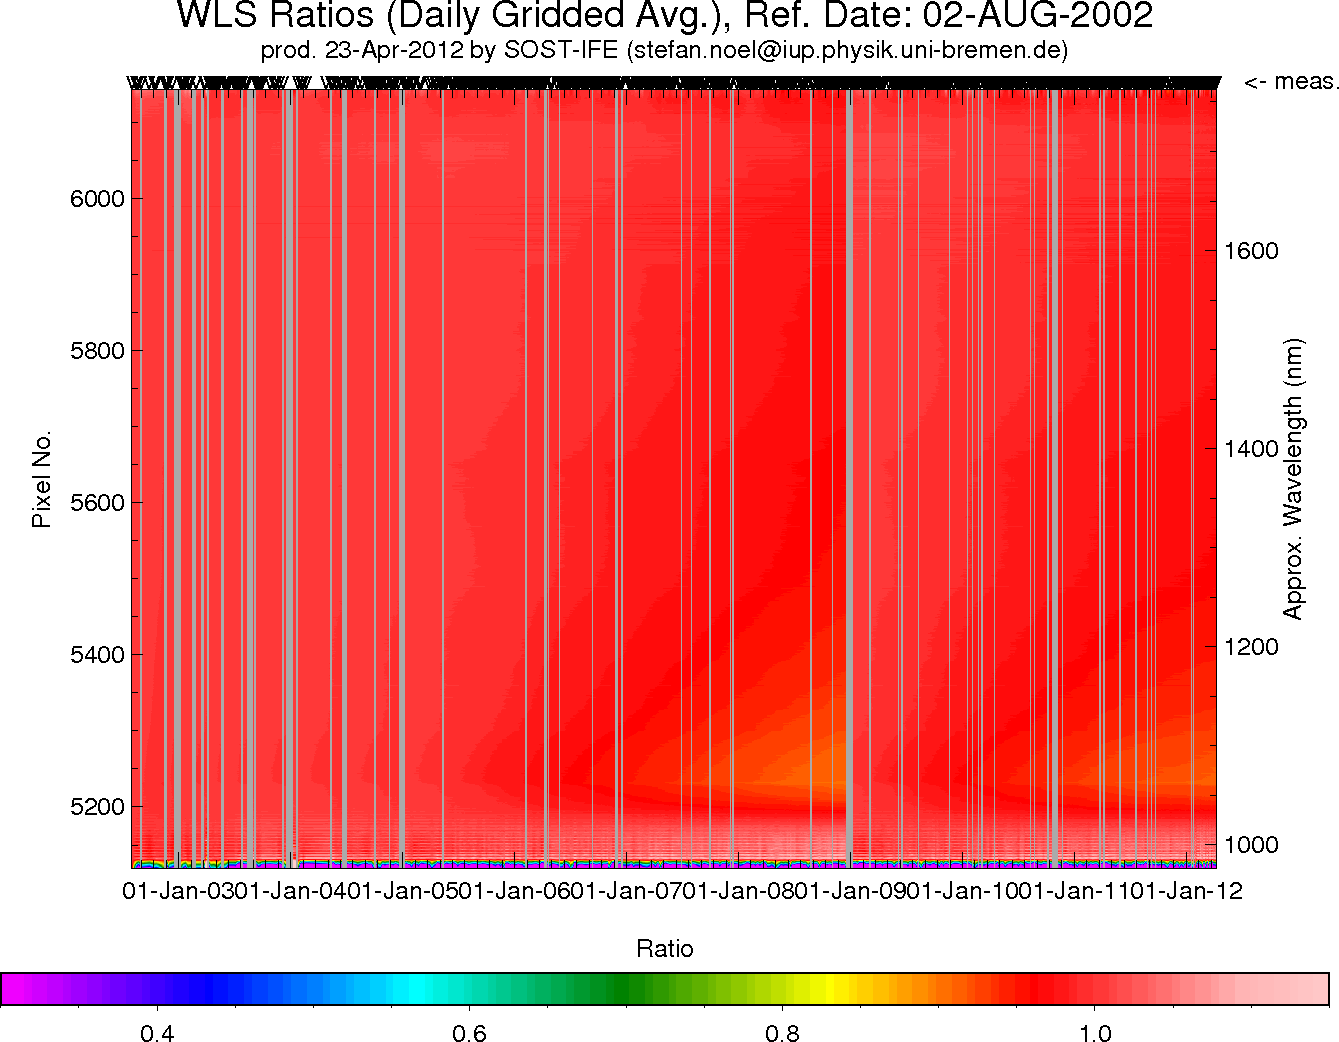
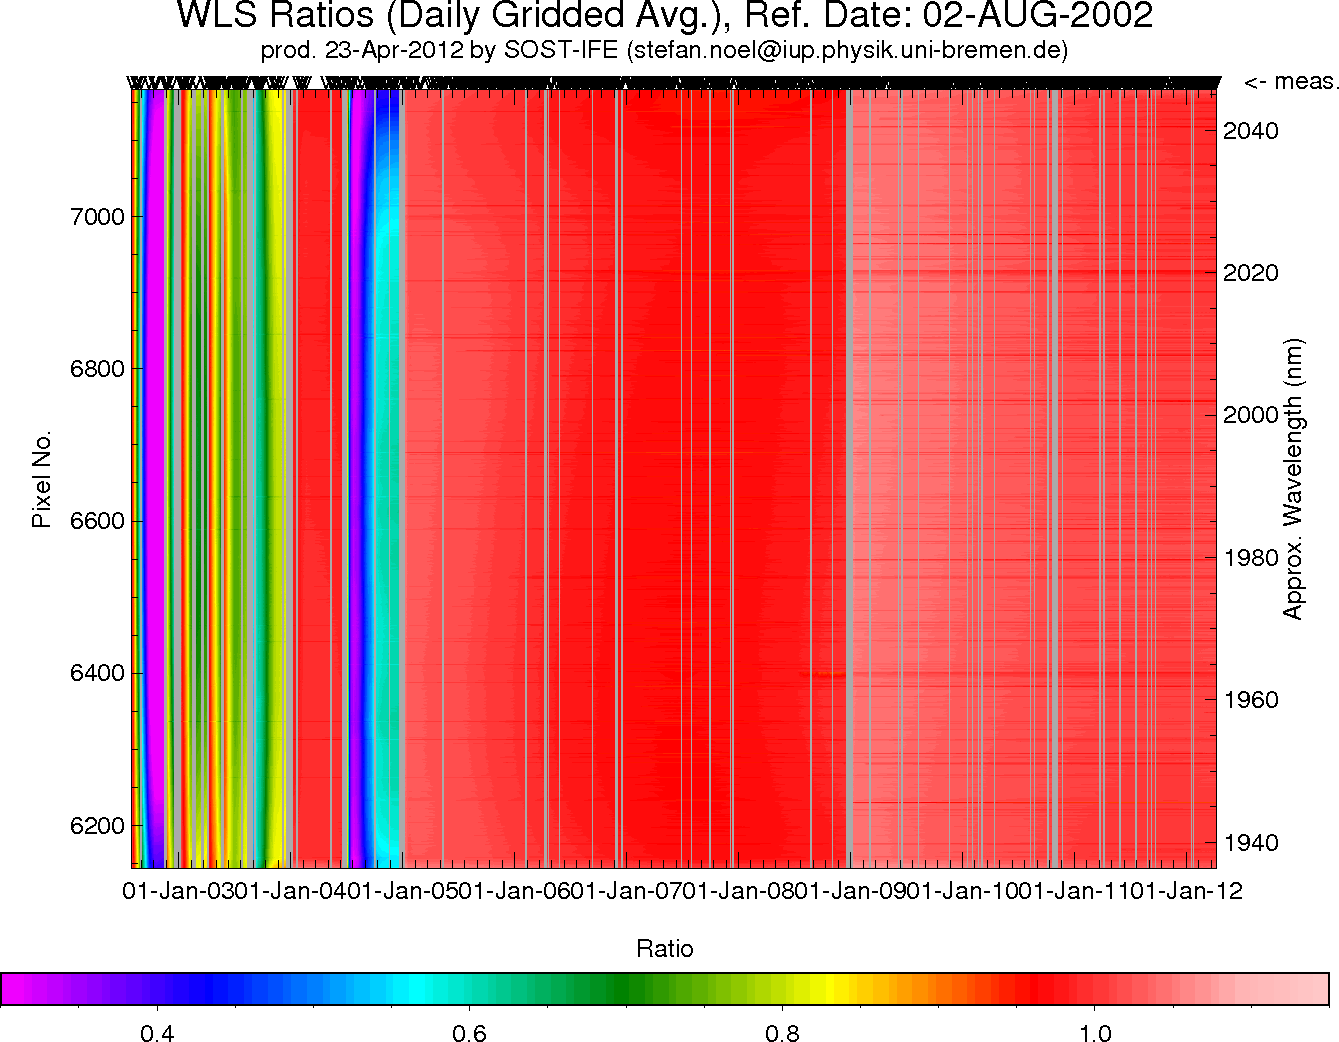
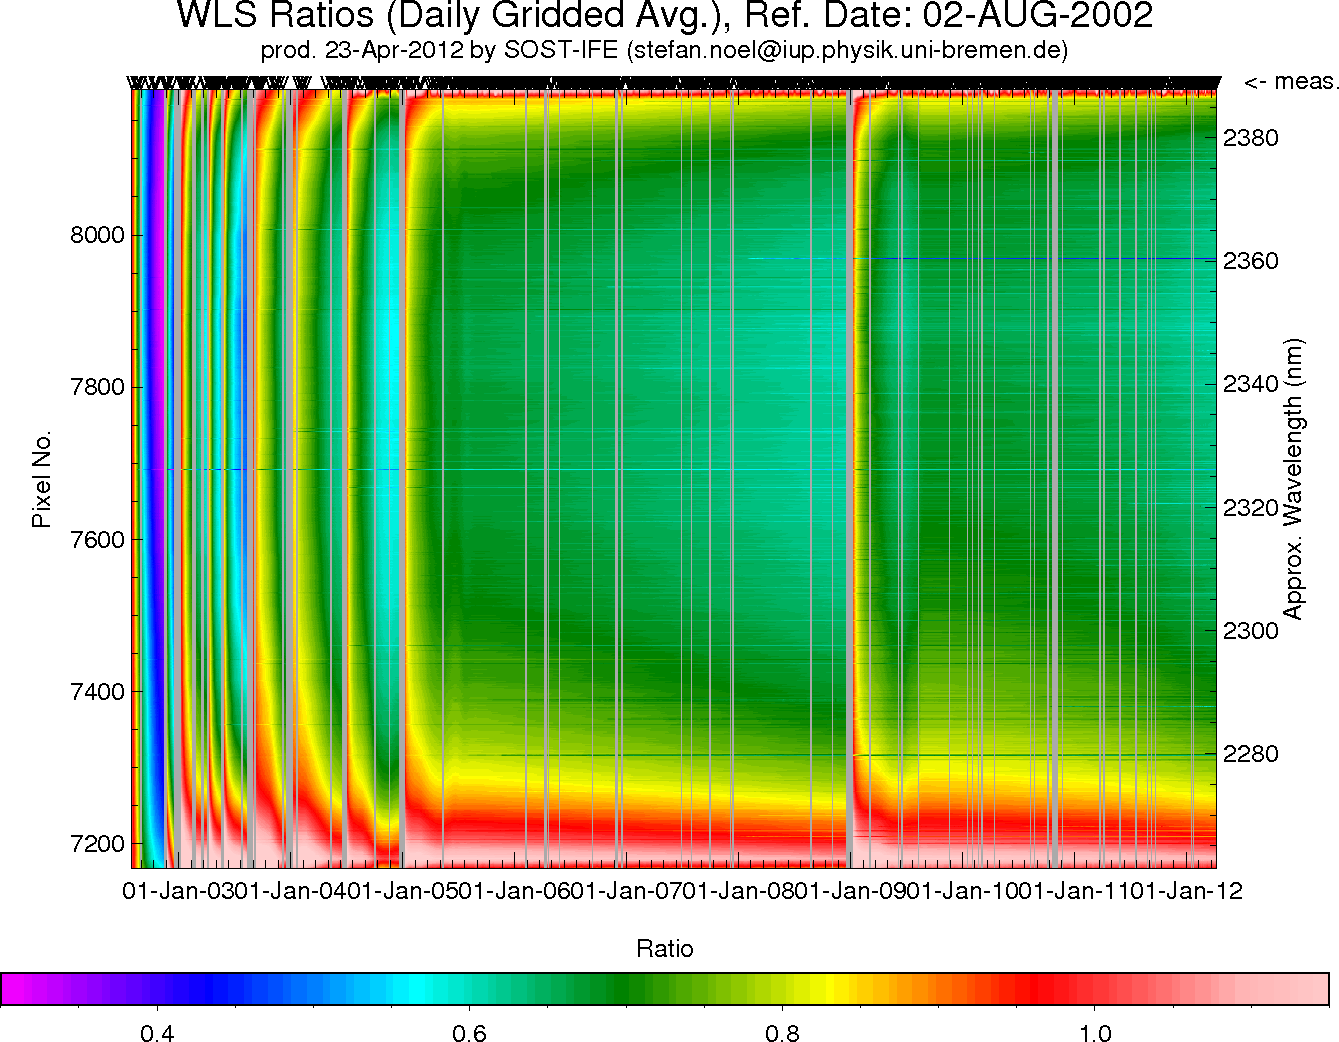
Results for the Nadir Light Path (WLS via ESM mirror)
Download the corresponding data
Note that the monitoring data presented here have been reprocessed using actual (Level 1b V6.x upwards) radiometric key data.
Notes:
- All data are preliminary!
- Dates in the graphs refer to UTC noon (12:00).
- Data have been interpolated over dead/bad pixels (using the on-ground list).
- Data from times of reduced instrument performance (like
decontaminations or instrument switch-offs) have not been considered.
These times are masked out by gray vertical bars.
- All data have been transformed to a daily grid, involving averaging and interpolation. "v"'s on the top of each graph denote those times where measurement data were available.
- Ratios have been performed on a pixel axis without any spectral interpolations. The wavelength axis is only for illustration and gives only approximate values, assuming a linear relation between pixel number and wavelength.
- Depending on the availability of measurement data, features close to large data gaps (especially before and after a decontamination) may be caused by interpolation.
- WLS data have not been corrected for a potential degradation of the lamp. Only the intensity jump after the extended WLS usage in June 2003 has been removed.
Contact:
Stefan Noël (stefan.noel@iup.physik.uni-bremen.de)
Data Privacy