Bild des Monats 2022 -2023
Dezember 2023:
Zur Überwachung und Modellierung von vulkanischen Emissionen
Alexandros Panagiotis Poulidis 1, Simon Bittner 1, Andreas Richter 2 and Mihalis Vrekoussis 1,2,3
1 Institute of Environmental Physics (IUP-UB), University of Bremen, Bremen, Germany
2 Center of Marine Environmental Science (MARUM), University of Bremen, Germany
3 Climate and Atmosphere Research Center (CARE-C), The Cyprus Institute, Nicosia, Cyprus
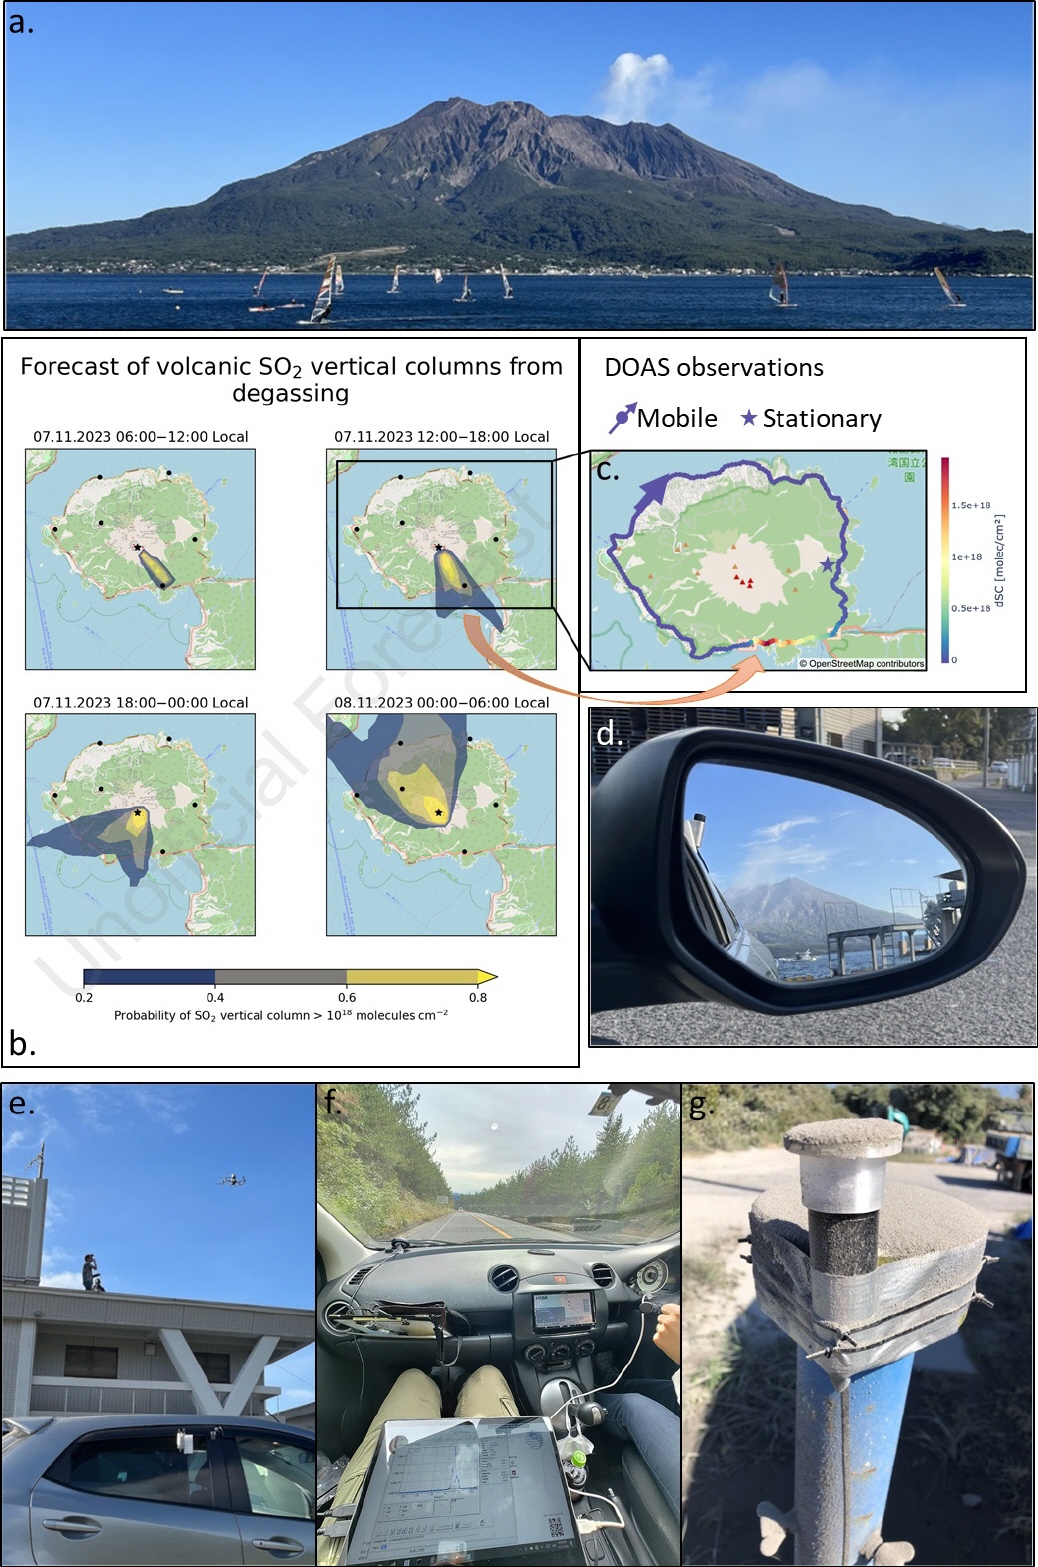
VOLCOM-Kampagne: Aufgrund des verheerenden Potenzials von Vulkanen konzentriert sich die wissenschaftliche Gemeinschaft in der Regel auf die Auswirkungen großflächiger Eruptionen und lässt eine Lücke bei der Untersuchung der weniger spektakulären, aber ebenso wichtigen nicht-explosiven Emissionen von Vulkanen. Die Messung und Modellierung der Ausgasung dieser Emissionen war das Hauptziel der VOLCOM-Kampagne (Volcanic Emissions Observation and Modeling) - einer Pilot-Fallstudie zur Beobachtung nahezu konstanter „passiver“ vulkanischer Emissionen, die von den Gruppen LAMOS und DOAS am IUP vom 3. bis 17. November 2023 durchgeführt wurde. Unser Ziel war der Vulkan Sakurajima in Japan, einer der aktivsten Vulkane der Welt (Abb. 1a).
Für die Beobachtungen wurden zwei DOAS-Geräte eingesetzt, eines für stationäre und eines für mobile Messungen (Abb. 1d,f,g). Obwohl der Schwerpunkt der Kampagne auf vulkanischen Gasemissionen lag, muss bei der Feldarbeit an einem aktiven Vulkan (auch in Zeiten relativ geringer Aktivität) immer auch die Wahrscheinlichkeit von Ascheregen berücksichtigt werden (Abb. 1g)! Mit der Kampagne wurden zwei spezifische Ziele verfolgt. Erstens sollten die Fähigkeiten eines automatisierten, anpassungsfähigen Vorhersageprogramms getestet werden, das von der LAMOS-Gruppe entwickelt wurde (Abb. 1b), und zweitens sollte die Leistung eines neuen Temperaturstabilisierungsgeräts, das hochwertige mobile DOAS-Messungen ermöglicht, unter realen Bedingungen eingesetzt und getestet werden (Abb. 1c,d).
Während der Kampagne ermöglichte uns die Echtzeitanalyse der mobilen DOAS-Beobachtungen (Abb. 1f), die durch den vernachlässigbaren SO2-Hintergrund begünstigt wurde, gezielte Messungen über und entlang der Abgasfahne in bis zu 50 km Entfernung von der Quelle durchzuführen. Die im Rahmen der Kampagne gesammelten Daten werden dazu dienen, unser Verständnis der vulkanischen Gasemissionen des Sakurajima sowie ihre Darstellung in chemischen Modellen zu verbessern.
Teilnehmer: Die Kampagne wurde in internationaler Zusammenarbeit zwischen dem IUP und der Universität Kyoto (Japan), der Universität Genf (Schweiz), der Universität Clermont Auvergne (Frankreich) und dem Nationalen Forschungsinstitut für Geowissenschaften und Katastrophenschutz (Japan) durchgeführt, was verschiedene synergistische Messungen ermöglichte (z. B. Abb. 1e).
Danksagung:
Die VOLCOM-Kampagne wurde durch Zuschüsse der Japan Society for the Promotion of Science, des Impulsprogramms der Universität Bremen und des Postgraduate International Programme in Physics and Electrical Engineering (PIP) sowie des Integrated Program for the Next Generation Volcano Research and Human Resource Management-Projekts unterstützt, das vom japanischen Ministerium für Bildung, Kultur, Sport, Wissenschaft und Technologie finanziert wurde. Die Vorhersagen wurden auf dem HPC-Cluster Aether an der Universität Bremen durchgeführt, das von der DFG im Rahmen der Exzellenzinitiative finanziert wird.
November 2023:

Während des Polarfrühlings werden bei Messungen häufig sehr niedrige Ozonkonzentrationen in Oberflächennähe festgestellt. Diese bekannten Ozonabbauprozesse sind das Ergebnis eines halogenkatalysierten Ozonabbaus. Die Halogene stammen aus dem Meerwasser und werden über die Kryosphäre von solebedecktem Eis, Eisblumen oder Schnee in die Atmosphäre übertragen. Dies ist zwar ein natürliches Phänomen, steht aber im Zusammenhang mit der anthropogenen Quecksilberverschmutzung, da Bromverbindungen auch gasförmiges Quecksilber in seine partikuläre Form überführen. Letztere lagern sich auf Schnee und Eis ab und können dann in das Ökosystem der Ozeane gelangen.
Während die Photochemie, die zum Ozonabbau führt, schnell und lokal abläuft, werden die Bedingungen für den Ozonabbau häufig von der großräumigen Meteorologie beeinflusst. Dies wurde in einer kürzlich erschienenen Veröffentlichung von Zilker et al. [2023] für die arktische Station in Ny-Ålesund eingehend untersucht. Beim Vergleich der meteorologischen Bedingungen in der arktischen Region an Tagen mit und ohne Ozonbeobachtungen in Ny-Ålesund ergaben sich klare Muster. Wie erwartet sind die satellitenbeobachteten troposphärischen BrO-Säulen während ozonarmer Ereignisse in der Gegend um Ny-Ålesund und in einem großen Gebiet bis nach Grönland höher. In ähnlicher Weise werden an diesen Tagen niedrigere Temperaturen um Ny-Ålesund sowie eine ausgeprägte negative Anomalie des Oberflächendrucks östlich von Spitzbergen festgestellt. Die Kombination aus niedrigem Druck über der Barentssee und anomal hohem Druck in der Region des Islandtiefs führt zu einer Blockadesituation, die kalte Polarluft nach Ny-Alesund bringt.
Da die Temperaturen in der Arktis viel schneller ansteigen als in anderen Regionen der Welt, werden für die Zukunft erhebliche Veränderungen in der arktischen Meteorologie und damit auch polare Ozonabbauereignisse erwartet, mit schwer vorhersehbaren Auswirkungen auf die Photochemie in der arktischen Grenzschichtluft.
Zilker, B., Richter, A., Blechschmidt, A.-M., von der Gathen, P., Bougoudis, I., Seo, S., Bösch, T., and Burrows, J. P.: Investigation of meteorological conditions and BrO during ozone depletion events in Ny-Ålesund between 2010 and 2021, Atmos. Chem. Phys., 23, 9787–9814, https://doi.org/10.5194/acp-23-9787-2023, 2023.
Oktober 2023:
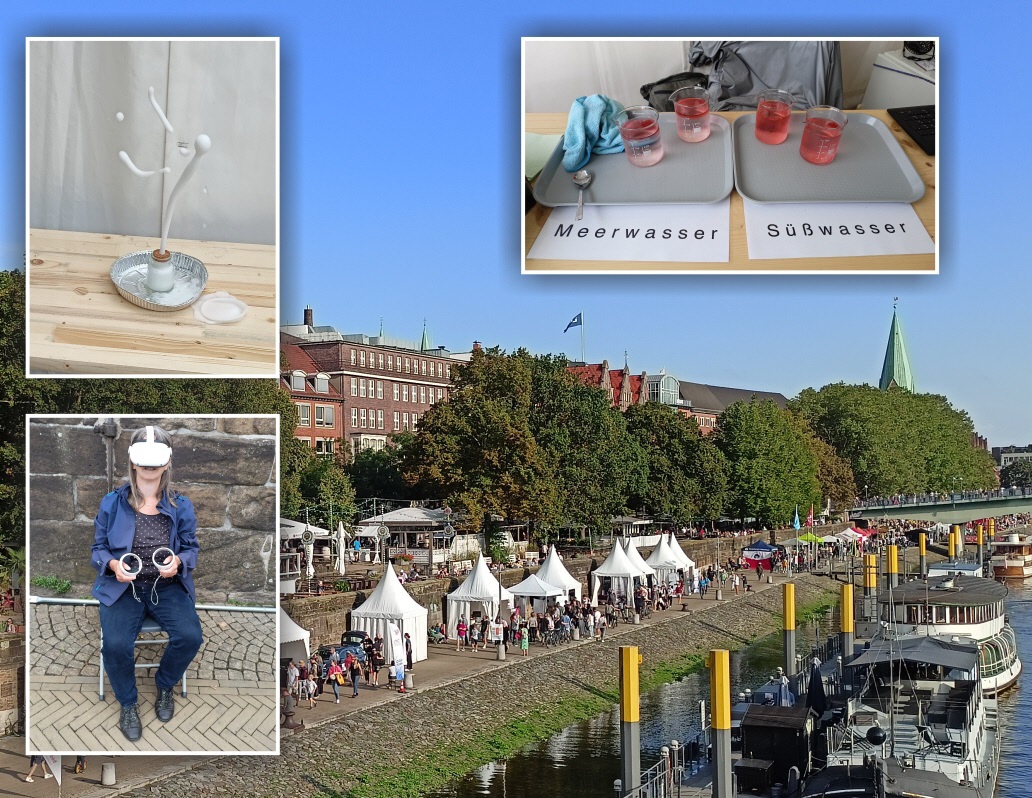
Feuer und Eis: Das IUP bei der Forschungsmeile 2023
Auch in diesem Jahr nahm das IUP an der Forschungsmeile im Rahmen der Maritimen Woche teil. Am 16. Und 17. September 2023 wurden an der Weserpromenade „Schlachte“ unterschiedliche Forschungsbereiche der Öffentlichkeit präsentiert. Mit dabei war auch wieder das „Eiswürfelexperiment“ zur Beantwortung der Frage: Wo schmilzt ein Eiswürfel schneller, in Süßwasser oder Meerwasser? Außerdem konnten kleine und große Besucher*innen sich auch über den Einfluss von Vulkanen auf das Klima informieren und sogar einen kleinen „Vulkan“ ausbrechen lassen. Ein Ausflug in die virtuelle Realität mit Bildern von einer Polarstern-Expedition ins Eismeer war auch möglich.
Kontakt: Stefan Noël (stefan.noel@iup.physik.uni-bremen.de)
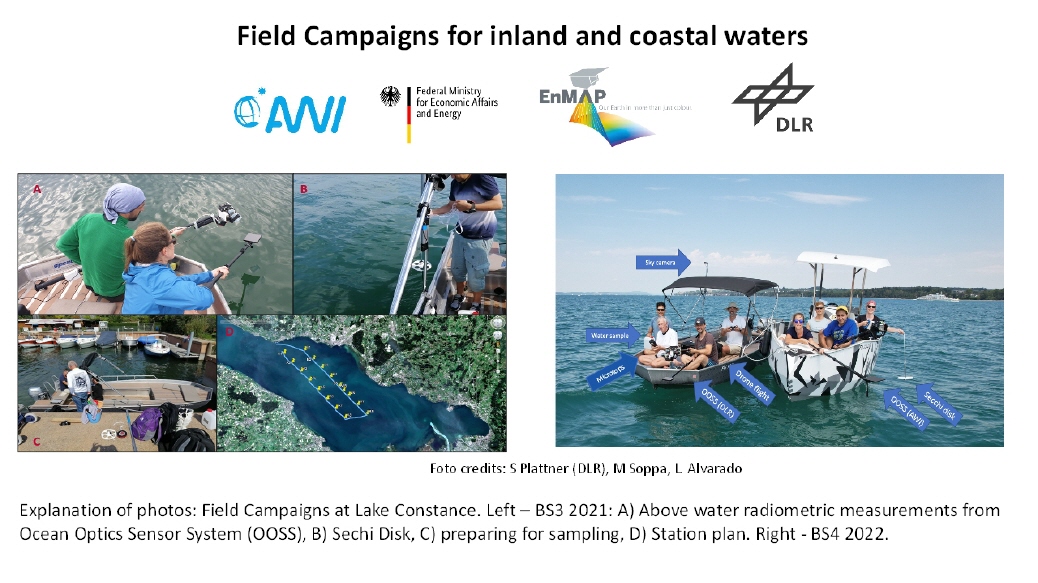
Feldkampagnen für Binnen- und Küstengewässer
Das Bild zeigt die AWI- und DLR-Teams während der Feldkampagnen am Bodensee im Jahr 2020 und, in jüngerer Zeit, im Jahr 2022. Mehrere Messungen wurden synchron mit den Satellitenaufnahmen durchgeführt, darunter die Reflexion über Wasser, die Gesamtmenge der Schwebstoffe und die Absorption von Phytoplankton und farbigen gelösten organischen Stoffen. Diese Daten werden zur Validierung von Level-2- und Level-3-Ozeanfarbprodukten von hyperspektralen und multispektralen Satellitensensoren und zur Entwicklung biooptischer Algorithmen zur Ermittlung verschiedener optischer Wasserbestandteile (gelöste organische Stoffe, Phytoplanktongruppen und andere Partikel) verwendet. Das Bild auf der rechten Seite zeigt eine Reihe von Messungen, die während der EnMAP-Validierungskampagne durchgeführt wurden. Der deutsche Umweltsatellit EnMAP wurde am 1. April 2022 erfolgreich gestartet. In den nächsten Jahren wird die Hyperspektralmission Bilder der Erdoberfläche in rund 250 Farben ("Spektralbänder") aufnehmen und damit detailliertere Informationen über Binnen- und Küstengewässer liefern als je zuvor.
Weitere Informationen finden Sie unter https://www.enmap.org/
Veröffentlichungen der Phytooptics Gruppe unter https://www.awi.de/index.php?id=2556&L=1.
Kontakt:
Dr. Mariana A. Soppa (msoppa@awi.de)
Prof. Dr. Astrid Bracher (abracher@awi.de)
Juli 2023:
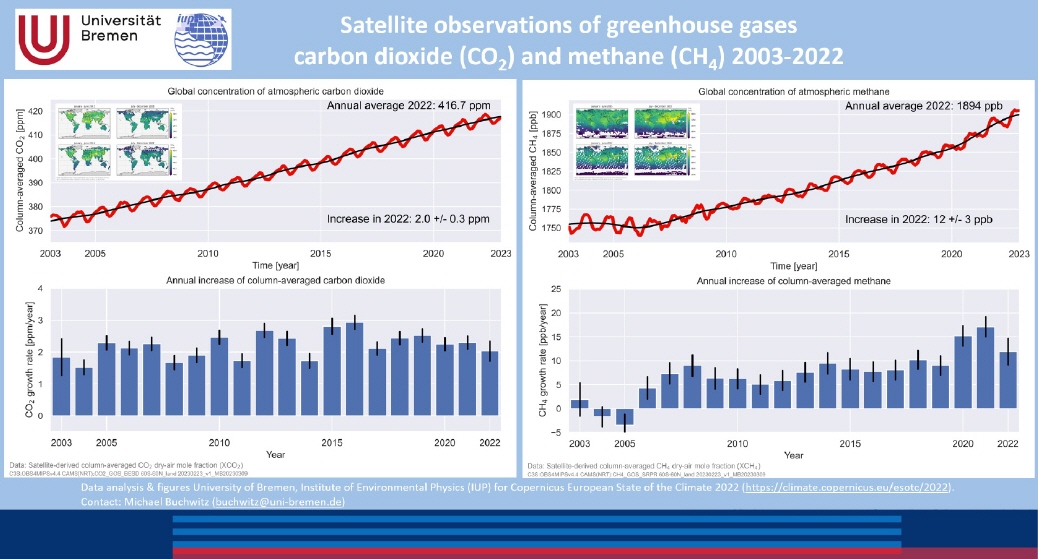
Treibhausgase CO2 und Methan steigen weiter an
Kohlenstoffdioxid (CO2) und Methan (CH4) sind wichtige Treibhausgase und steigende atmosphärische Konzentrationen führen zu Erderwärmung. Das IUP der Universität Bremen entwickelt Methoden, um die atmosphärischen Verteilungen dieser beiden wichtigen Gase vom Weltraum aus zu messen [1] und zu interpretieren [2].
Das IUP stellt diese Daten kostenlos für alle interessierten Nutzer zur Verfügung, und zwar entweder über IUP-Webseiten (siehe https://www.iup.uni-bremen.de/carbon_ghg/ und dortige Links) oder über Dritte (z.B. ESA (https://climate.esa.int/en/projects/ghgs/) oder Copernicus Klimawandelservice [3] [4]).
Leider zeigen die Zeitreihen beide Gase derzeit nur einen Trend, nämlich nach oben, siehe Abbildung. Der Grund sind steigende Emissionen wobei für Methan auch eine Abnahme des chemischen Methanabbaus in der Atmosphäre einen Beitrag liefert, zu mindestens in einigen Jahren. Der Hauptgrund für steigende CO2-Konzentrationen liegt in der Verbrennung fossiler Brennstoffe (Öl, Kohle, Erdgas). Bei Methan spielen auch natürliche Quellen wie Sümpfe eine wichtige Rolle.
Weitere Erläuterungen und Details zu dieser Thematik und was uns diese Satellitendaten zeigen siehe das aktuelle „European State of the Climate“ Assessment [5].
Referenzen:
[1] Reuter, M., Buchwitz, M., Schneising, O., Noel, S., Bovensmann, H., Burrows, J. P., Boesch, H., Di Noia, A., Anand, J., Parker, R. J., Somkuti, P., Wu, L., Hasekamp, O. P., Aben, I., Kuze, A., Suto, H., Shiomi, K., Yoshida, Y., Morino, I., Crisp, D., O'Dell, C. W., Notholt, J., Petri, C., Warneke, T., Velazco, V. A., Deutscher, N. M., Griffith, D. W. T., Kivi, R., Pollard, D. F., Hase, F., Sussmann, R., Te, Y. V., Strong, K., Roche, S., Sha, M. K., De Maziere, M., Feist, D. G., Iraci, L. T., Roehl, C. M., Retscher, C., and Schepers, D.: Ensemble-based satellite-derived carbon dioxide and methane column-averaged dry-air mole fraction data sets (2003-2018) for carbon and climate applications, Atmos. Meas. Tech., 13, 789-819, https://doi.org/10.5194/amt-13-789-2020, 2020.
[2] Buchwitz, M., Reuter, M., Schneising, O., Noel, S., Gier, B., Bovensmann, H., Burrows, J. P., Boesch, H., Anand, J., Parker, R. J., Somkuti, P., Detmers, R. G., Hasekamp, O. P., Aben, I., Butz, A., Kuze, A., Suto, H., Yoshida, Y., Crisp, D., and O'Dell, C., Computation and analysis of atmospheric carbon dioxide annual mean growth rates from satellite observations during 2003-2016, Atmos. Chem. Phys., 18, 17355-17370, https://doi.org/10.5194/acp-18-17355-2018, 2018.
[3] https://cds.climate.copernicus.eu/cdsapp#!/dataset/satellite-carbon-dioxide?tab=overview
[4] https://cds.climate.copernicus.eu/cdsapp#!/dataset/satellite-methane?tab=overview
[5] https://climate.copernicus.eu/climate-indicators/greenhouse-gas-concentrations
Juni 2023:
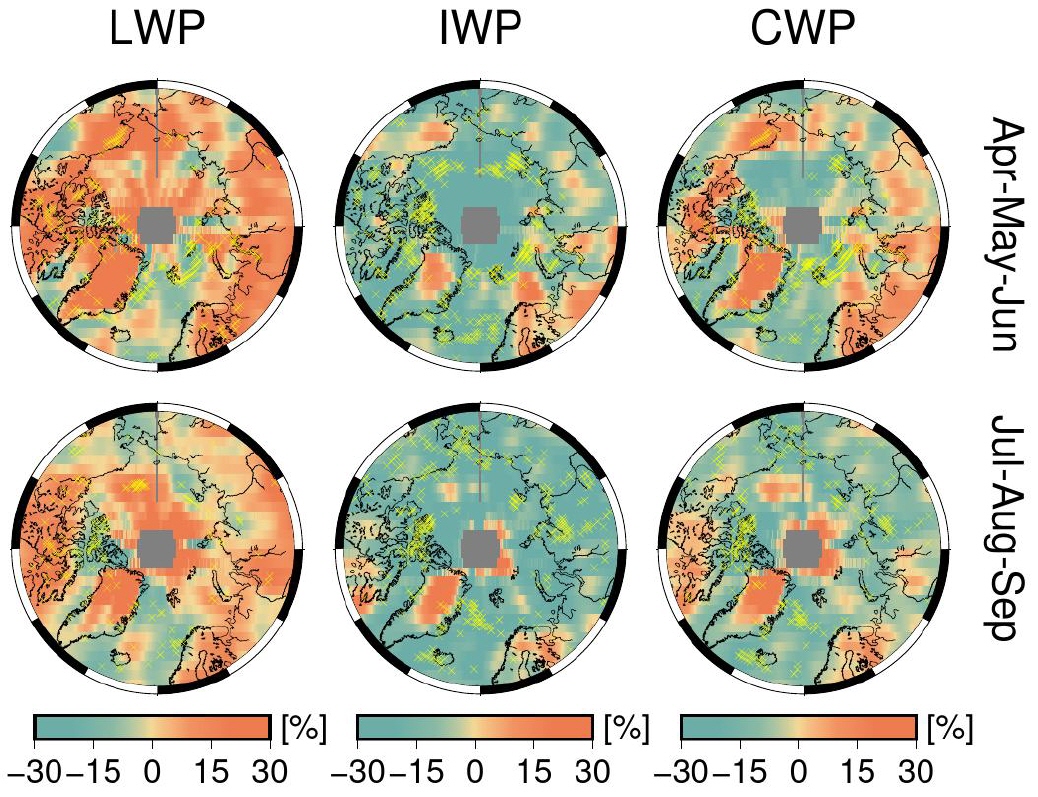
Arktische Wolken sind ein wichtiger Faktor in der Beeinflussung des arktischen Klimas. Sie wirken dabei sowohl erwärmend als auch abkühlend. Die Gründe wann sie erwärmend oder abkühlend wirken hängen von verschiedenen Faktoren ab. Hierzu gehören u.a. auch die thermodynamische Phase der Wolken (also bis zu welchem Grad sie flüssig oder gefrorenes Wasser beinhalten). Im Rahmen einer aktuellen Studie hat die Aerosol & Wolkengruppe des IUP/Ubremen systematisch Satellitendaten der Wolkenphase analysiert.
Einige Wolkeneigenschaften haben sich in den letzten drei Dekaden deutlich geändert. So hat der z.B. der Flüssigwasserpfad (eng. Liquid Water Path, LWP) in den meisten Regionen der Arktis zugenommen. Im ähnlichen Umfang wie der LWP zugenommen hat, hat der Eiswasserpfad (engl. Ice Water Path, IWP) abgenommen. Das hat wesentliche Konsequenzen für den Strahlungshaushalt in der Arktis.
Referenz:
Lelli, L., Vountas, M., Khosravi, N., and Burrows, J. P.: Satellite remote sensing of regional and seasonal Arctic cooling showing a multi-decadal trend towards brighter and more liquid clouds, Atmos. Chem. Phys., 23, 2579–2611, https://doi.org/10.5194/acp-23-2579-2023, 2023.
Kontakt: Marco Vountas vountas@iup.physik.uni-bremen.de
https://www.iup.uni-bremen.de/aerosol
April 2023:
Regimeorientierte Kausalanalyse der atlantisch-pazifischen Telekonnektionen in CMIP6
Die Modi der natürlichen Klimavariabilität auf interannuellen bis multidekadischen Zeitskalen haben große Auswirkungen auf das regionale und globale Klima mit bedeutenden sozioökonomischen Folgen (Eyring et al., 2021). Trotz ihrer Bedeutung bleibt die systematische Bewertung von Klimamodellen und deren Simulation der internen Variabilität eine anspruchsvolle Aufgabe (Eyring et al., 2019). Hier bietet die Kausalerkennung eine Möglichkeit, dynamische Klimaabhängigkeiten aus Zeitreihendaten abzuschätzen. In Karmouche et al. (2022) führen wir eine regimeorientierte kausale Modellevaluation durch, um die Fähigkeit der am Coupled Model Intercomparison Project Phase 6 (CMIP6, Eyring et al., 2016) teilnehmenden Modelle zu bewerten, die beobachteten wechselnden Wechselwirkungen zwischen der pazifischen dekadischen Variabilität (PDV) und der atlantischen multidekadischen Variabilität (AMV) und ihren außertropischen Telekonnektionen zu den pazifischen nord- und südamerikanischen Mustern (PNA und PSA1) darzustellen. Die Indizes für diese Modi der Klimavariabilität werden mit dem Climate Variability Diagnostic Package for Large Ensembles (CVDP-LE, Phillips et al., 2020) berechnet.
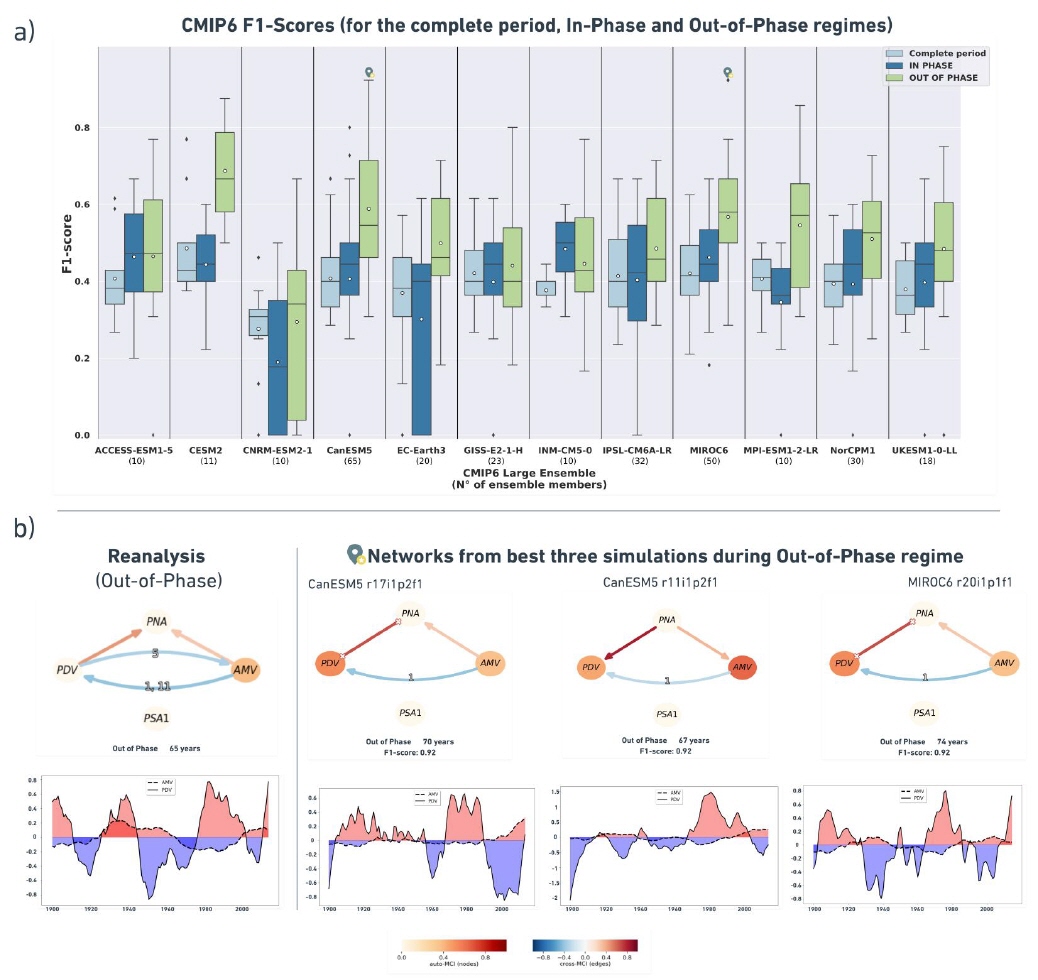
Unsere Abbildung des Monats zeigt einen Vergleich der kausalen Netzwerke für Reanalysedatensätze (ERSSTv5 für PDV und AMV, ERA20C_ERA5 für PNA und PSA1) und historische CMIP6 Large Ensemble (LE) Simulationen für den Zeitraum 1900-2014. Es wird angenommen, dass die Wechselwirkungen zwischen den oben genannten Formen der Klimavariabilität je nach dem physikalischen Zustand des Atlantiks oder des Pazifiks (d. h. AMV- oder PDV-Phase) unterschiedlichen Regimen folgen. Um phasenabhängige Zusammenhänge (Kausalnetzwerke) zu identifizieren, führen wir die Analyse für kürzere Zeiträume (Regime) durch, die verschiedene Phasen auf der Grundlage der tiefpassgefilterten AMV- und PDV-Indizes repräsentieren, und identifizieren so die regimeorientierte Analyse. Hier bezeichnen wir die Zeiträume, in denen AMV und PDV in derselben Phase liegen (beide positiv oder beide negativ) als „In-Phase-Regime“, während wir für die Zeiträume, in denen die beiden Indizes in entgegengesetzten Phasen liegen (einer negativ, der andere positiv), den Begriff „Out-of-Phase-Regime“ verwenden.
Wir wenden die PCMCI+-Methode (Runge et al., 2019; Runge, 2020) an, die als Teil des Tigramite-Pakets verfügbar ist, um kausale Netzwerke aus CMIP6 Large Ensemble-Modellen zu schätzen und die Ergebnisse mit denen aus Reanalysedaten während verschiedener bestimmter Zeiträume zu vergleichen. Blaue Verbindungen in den resultierenden Kausaldiagrammen bedeuten eine Reaktion mit entgegengesetztem Vorzeichen, während rote Verbindungen eine Reaktion mit gleichem Vorzeichen bedeuten. Die Beschriftung der Verbindungen gibt die Zeitverzögerung der Reaktion in Jahren an. Die Abbildung zeigt (a) ein Whisker-Diagramm für die Verteilung der F1-Werte, ein Maß für die Ähnlichkeit zwischen kausalen Netzwerken nach den Methoden von Nowack et al. (2020), über die CMIP6 LEs während des gesamten Zeitraums, des In-Phase-Regimes und des Out-of-Phase-Regimes mit hellblauen, dunkelblauen bzw. grünen Farbkästchen. Die weißen Streupunkte zeigen an, dass die LEs von CESM2, CanESM5, MIROC6 und MPI-ESM1-2-LR im Durchschnitt eine bessere Netzwerkähnlichkeit mit den Beobachtungen während der Out-of-Phase-Periode aufweisen.
CanESM5 und MIROC6 LEs haben die höchsten Werte (0,92) während dieses Regimes, wie durch die Positionsmarkierungen auf dem Whisker-Plot angezeigt. In (b) vergleichen wir die Kausaldiagramme (drei Felder auf der rechten Seite) dieser Top-Scoring-Realisierungen und ihre tiefpassgefilterten AMV- und PDV-Zeitreihen mit denen, die aus Referenz-Reanalysedatensätzen (links) generiert wurden. Die Netze in (b) stimmen bei der um ein Jahr verzögerten AMV→PDV-Verbindung überein, was eine Reaktion mit entgegengesetztem Vorzeichen veranschaulicht. Die positive zeitgleiche PDV-PNA-Verbindung ist in CanESM5 r11i1p2f1 anders gerichtet als in der Reanalyse und bleibt in CanESM5 r17i1p2f1 und MIROC6 r20i1p1f1 unorientiert. Die Out-of-Phase-Diagramme dieser Realisierungen zeigen auch eine Übereinstimmung bei einer zeitgleichen AMV-PNA-Verbindung gleichen Vorzeichens, die schwächer ist (niedrigerer Cross-MCI-Wert) als die PDV-PNA-Verbindung. Insgesamt hat die regimeorientierte kausale Modellbewertung nach Karmouche et al. (2022) das Potenzial einer leistungsfähigen Methodik, die in einer Reihe von umweltbezogenen Themen angewandt werden kann und enorme Erkenntnisse zur Verbesserung des Verständnisses des komplexen Erdsystems und des Stands der Klimamodellierung bietet.
REFERENZEN:
Eyring, V., Bony, S., Meehl, G. A., Senior, C. A., Stevens, B., Stouffer, R. J., and Taylor, K. E.: Overview of the Coupled Model Intercomparison Project Phase 6 (CMIP6) experimental design and organization, Geoscientific Model Development, 9, 1937–1958, 2016.
Eyring, V., Cox, P. M., Flato, G. M., Gleckler, P. J., Abramowitz, G., Caldwell, P., Collins, W. D., Gier, B. K., Hall, A. D., Hoffman, F. M., et al.: Taking climate model evaluation to the next level, Nature Climate Change, 9, 102–110, 2019
Eyring, V., Gillett, N., Achutarao, K., Barimalala, R., Barreiro Parrillo, M., Bellouin, N., Cassou, C., Durack, P., Kosaka, Y., McGregor, S., et al.: Human Influence on the Climate System: Contribution of Working Group I to the Sixth Assessment Report of the Intergovernmental Panel on Climate Change, IPCC Sixth Assessment Report, 2021
Karmouche, S., Galytska, E., Runge, J., Meehl, G. A., Phillips, A. S., Weigel, K., and Eyring, V.: Regime-oriented causal model evaluation of Atlantic-Pacific teleconnections in CMIP6, EGUsphere [preprint], https://doi.org/10.5194/egusphere-2022-1013, 2022.
Nowack, P., Runge, J., Eyring, V., and Haigh, J. D.: Causal networks for climate model evaluation and constrained projections, Nature communications, 11, 1–11, 2020.
Phillips, A. S., Deser, C., Fasullo, J., Schneider, D., and Simpson, I.: Assessing Climate Variability and Change in Model Large Ensembles: A User’s Guide to the “Climate Variability Diagnostics Package for Large Ensembles”, version 1, version, 1, 0, 2020
Runge, J.: Discovering contemporaneous and lagged causal relations in autocorrelated nonlinear time series datasets, in: Conference on Uncertainty in Artificial Intelligence, pp. 1388–1397, PMLR, 2020.
Runge, J., Nowack, P., Kretschmer, M., Flaxman, S., and Sejdinovic, D.: Detecting and quantifying causal associations in large nonlinear time series datasets, Science advances, 5, eaau4996, 2019
März 2023:
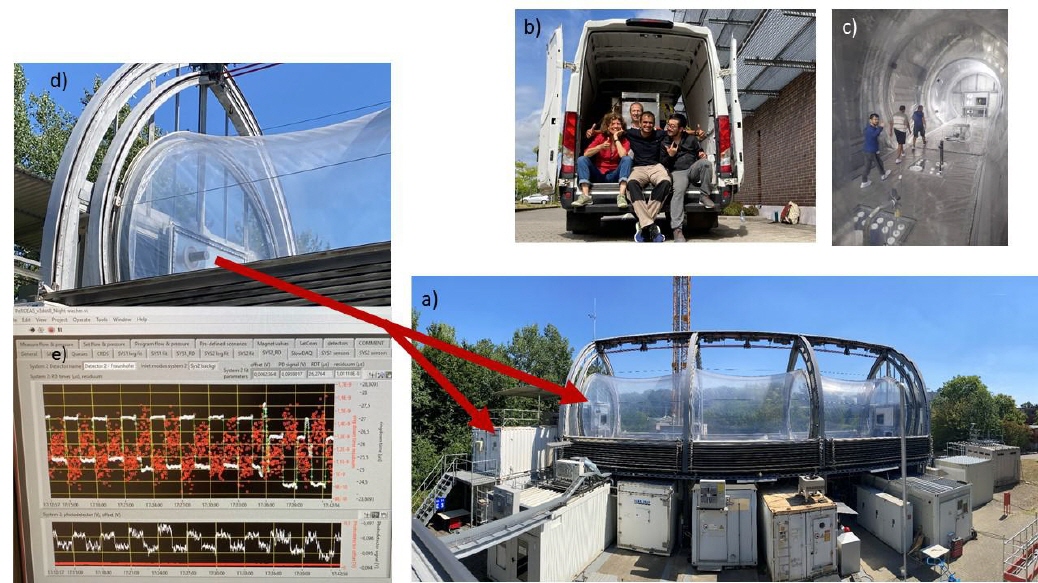
Workshop zur ROxCOMP22-Kampagne
Die Radikalchemie ist von großer Bedeutung für das Verständnis der chemischen Prozesse in der Atmosphäre und der Bildung von Sekundärschadstoffen. Die TROLAS-Gruppe (Tropospheric Radical Observations and Laser Absorption Spectroscopy) am Institut für Umweltphysik verfügt über weitreichende Erfahrungen bei der Untersuchung der Verteilung von Peroxy-Radikalen und ihren Vorläufern, die im Rahmen von flugzeuggestützten und bodengestützten Feldmessungen in verschiedenen Umgebungen beobachtet wurden.
Wissenschaftler von IUP-TROLAS haben mit dem luftgestützten PeRCEAS
(Peroxy Radical Chemical Enhancement and Absorption Spectrometer) Instrument erfolgreich an der einmonatigen internationalen Vergleichsstudie ROxCOMP22 teilgenommen. Ziel von ROxCOMP22 war es, die Qualität des Nachweises von Peroxy-Radikalen zu verbessern, indem Instrumente mit unterschiedlichen Techniken zur Messung organischer Peroxy-Radikale weltweit zusammengebracht wurden. Die 16 Kammerexperimente, die im August 2022 in der SAPHIR-Kammer am Forschungszentrum Jülich durchgeführt wurden, boten eine einzigartige Gelegenheit, potenzielle Interferenzen oder systematische Fehler zu identifizieren, während relevante Radikalreaktionen unter kontrollierten chemischen Bedingungen untersucht wurden.
Nach einer Kalibrierungsphase in den Heimlabors fand im Februar 2023 der erste Workshop zur Diskussion der gewonnenen ROxCOMP22-Daten statt. Die Datenanalyse ist noch nicht abgeschlossen.
Kontakt: Lola Andrés Hernández lola@iup.physik.uni-bremen.de
Februar 2023:
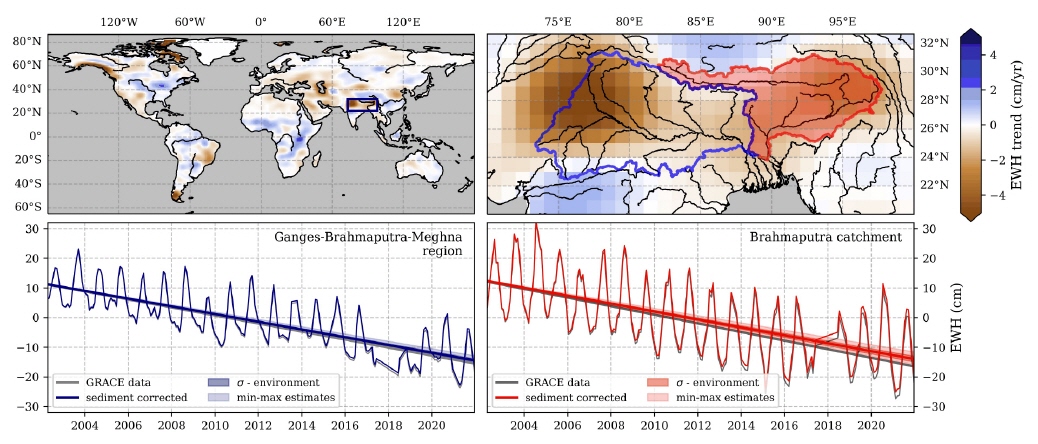
Von geodätischen Satelliten gemessene Schwerefelder liefern Informationen über globale Massenschwankungen und haben sich als entscheidend für die Überwachung von Veränderungen der Wasserspeicherung und -flüsse erwiesen. Daher ist die Satellitengravimetrie eine Schlüsselkomponente bei der Untersuchung der auf dem indischen Subkontinent beobachteten massiven Grundwasserverarmung. In einer aktuellen Studie untersuchen wir den Einfluss des Sedimenttransports in Flüssen auf terrestrische EWH-Daten, die von Satelliten des Gravity recovery and Climate Experiment (GRACE) und seiner Nachfolgemission (GRACE-FO) gemessen wurden.
Obwohl davon ausgegangen wird, dass der Massenverlust durch den Sedimenttransport in Flüssen unterhalb der Nachweisgrenze dieser Satelliten liegt, könnte er sich auf die aus ihren Daten abgeleiteten langfristigen EWH-Trends auswirken. Der indische Subkontinent wird von den Flüssen Ganges und Brahmaputra entwässert, die eines der sedimentreichsten Flusssysteme der Welt darstellen. In der Abbildung dieses Monats zeigen wir die Auswirkungen des Sedimentmassenverlusts innerhalb der Einzugsgebiete von Ganges und Brahmaputra auf die gravimetrischen Schätzungen der EWH-Trends. In der gesamten Ganges-Brahmaputra-Meghna-Region ist der Sedimenttransport für etwa 4 % des Schwereabfalls verantwortlich, der derzeit der Grundwassererschöpfung zugeschrieben wird. Da das meiste Sediment aus den Bergregionen erodiert wird, ist der Einfluss des Sedimenttransports auf die EWH-Trends in diesen Regionen hoch (durchschnittlich 14 %).
Kontakt: Alexandra Klemme (aklemme@uni-bremen.de)
Referenzen:
Boergens, Eva; Dobslaw, Henryk; Dill, Robert (2020): COST-G GravIS RL01 Continental Water Storage Anomalies. V. 0004. GFZ Data Services. https://doi.org/10.5880/COST-G.GRAVIS_01_L3_TWS
Januar 2023:
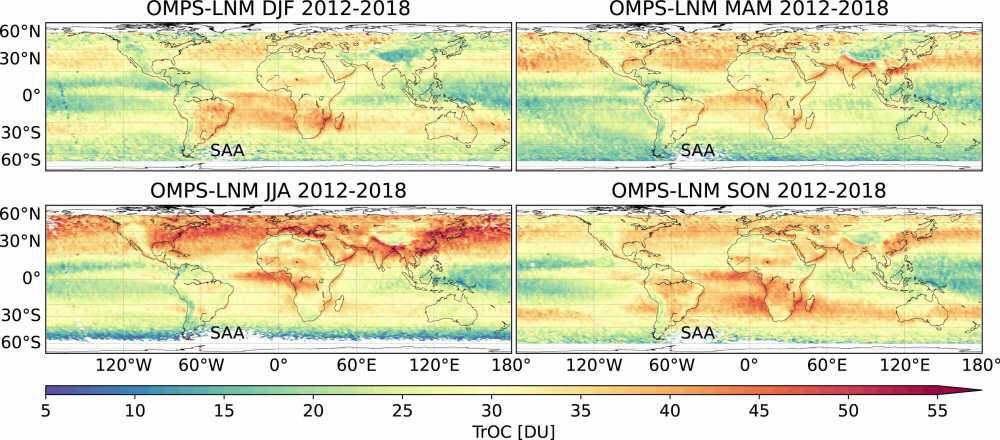
Die SUOMI-NPP-Plattform ist mit drei Instrumenten ausgestattet, die Ozon im Rand- und Nadirbereich messen. Der OMPS-Nadir Napper (NM) liefert die gesamte Ozonsäule vom Boden bis zur oberen Atmosphäre. Aus den Spektraldaten des OMPS-Limb Profilers (LP) werden vertikale Ozonprofile abgeleitet. Unter Verwendung der Ozondaten beider Instrumente wird die troposphärische Ozonsäule (vom Boden bis zur Tropopause, die je nach Breitengrad zwischen 7 und 17 km Höhe liegt) berechnet, indem die stratosphärische Säule von der Gesamtsäule abgezogen wird. Die Abbildung zeigt den globalen saisonalen Mittelwert des troposphärischen Ozons von 2012 bis 2018, wie von OMPS beobachtet. Die saisonalen Karten zeigen den variablen Abfluss von troposphärischem Ozon, z. B. aus Afrika (Biomasse verbrennende Regionen), Nordostamerika und Ostasien (beides Industrieregionen), wo Ozon aus chemischen Vorläufersubstanzen erzeugt wird, bei denen es sich hauptsächlich um Luftschadstoffe handelt.
Zusätzlich zum OMPS-Algorithmus für troposphärisches Ozon haben wir unsere fortschrittlichen Algorithmen verwendet, um die Gesamtsäule und die Profile von Ozon aus beiden OMPS-Instrumenten zu ermitteln. Ähnliche Algorithmen wurden auf SCIAMACHY-Satellitendaten (2002-2012) angewendet. Im nächsten Schritt werden wir die troposphärischen LMN-Ozondaten von SCIAMACHY und OMPS kombinieren, um einen Langzeitdatensatz von mindestens 16 Jahren zu erhalten, mit dem wir Veränderungen in dekadischen Zeitskalen untersuchen können.
Referenzen:
Arosio, C., Rozanov, A., Malinina, E., Eichmann, K.-U., von Clarmann, T., and Burrows, J. P.: Retrieval of ozone profiles from OMPS limb scattering observations, Atmos. Meas. Tech., 11, 2135–2149, https://doi.org/10.5194/amt-11-2135-2018, 2018.
Ebojie, F., von Savigny, C., Ladstätter-Weißenmayer, A., Rozanov, A., Weber, M., Eichmann, K.-U., Bötel, S., Rahpoe, N., Bovensmann, H., and Burrows, J. P., Tropospheric column amount of ozone retrieved from SCIAMACHY limb–nadir-matching observations, Atmos. Meas. Tech., 7, 2073-2096, https://doi.org/10.5194/amt-7-2073-2014, 2014.
Ebojie, F., Burrows, J. P., Gebhardt, C., von Savigny, C., Rozanov, A., Weber, M., and Bovensmann, H.: Global and zonal tropospheric ozone variations from 2003–2011 as seen by SCIAMACHY, Atmos. Chem. Phys., 16, 417-436, https://doi.org/10.5194/acp-16-417-2016, 2016.
Orfanoz-Cheuquelaf, A., Rozanov, A., Weber, M., Arosio, C., Ladstätter-Weißenmayer, A., and Burrows, J.P.: Total ozone column from Ozone Mapping and Profiler Suite Nadir Mapper (OMPS-NM) measurements using the broadband weighting function fitting approach (WFFA), Atmos. Meas. Tech., 14, 5771–5789, https://doi.org/10.5194/amt-14-5771-2021, 2021.
Orfanoz-Cheuquelaf, A, Arosio, C., Rozanov, A., Weber, M., Ladstätter-Weißenmayer, A., and Burrows, J.P., Tropospheric ozone column dataset from OMPS-LP/OMPS-NM limb-nadir matching, manuscript in preparation, 2022.
Dezember 2022:
Johann Rasmus Nüß1, Nikos Daskalakis1, Fabian Günther Piwowarczyk1, Angelos Gkouvousis2,3, Oliver Schneising1, Michael Buchwitz1, Maria Kanakidou1,2,3, Maarten C. Krol4,5, Mihalis Vrekoussis1,6,7
1 Institute of Environmental Physics (IUP-UB), University of Bremen, Bremen, Germany
2 Environmental Chemical Processes Laboratory (ECPL), Department of Chemistry, University of Crete, Heraklion, Greece
3 Center for the Study of Air Quality and Climate Change (C-STACC), Institute of Chemical Engineering Sciences, Foundation for Research and Technology Hellas, Patras, Greece
4 Meteorology and Air Quality, Wageningen University and Research, Wageningen, the Netherlands
5 Institute for Marine and Atmospheric Research, Utrecht University, Utrecht, the Netherlands
6 Center of Marine Environmental Science (MARUM), University of Bremen, Germany
7 Climate and Atmosphere Research Center (CARE-C), The Cyprus Institute, Nicosia, Cyprus
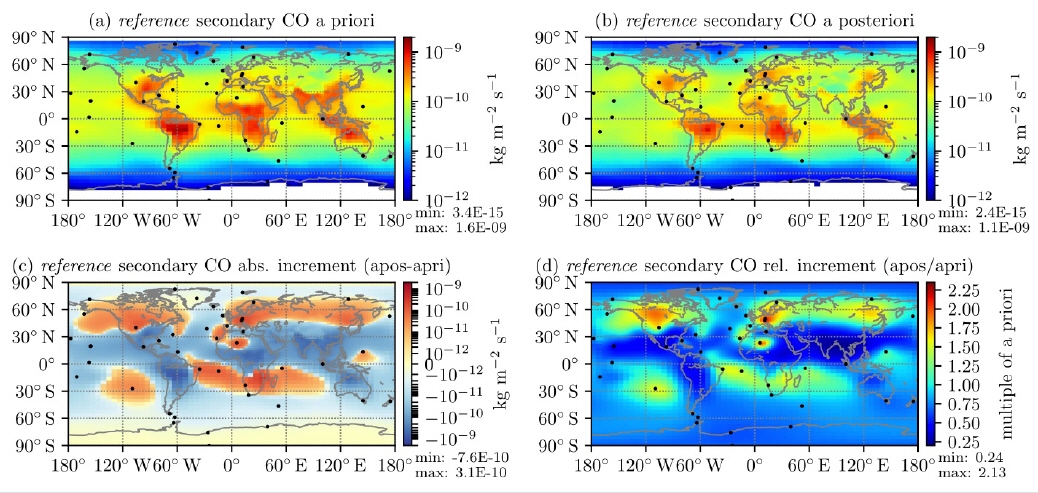
Kohlenmonoxid (CO) in der Atmosphäre wirkt sich nachteilig auf die Luftqualität und das Klima aus, weshalb die Kenntnis seiner Quellen von entscheidender Bedeutung ist. Die derzeitigen globalen Bottom-up-Emissionsschätzungen sind jedoch noch mit erheblichen Unsicherheiten behaftet. Wir versuchen, diese Unsicherheiten zu verringern, indem wir die Emissionsschätzungen für die zweite Hälfte des Jahres 2018 auf globaler Ebene mit Schwerpunkt auf der nördlichen Hemisphäre durch den Top-down-Ansatz der inversen Modellierung optimieren. Konkret führen wir Beobachtungen des TROPOspheric Monitoring Instrument (TROPOMI) in das TM5-4DVAR-Modell ein. Die Emissionen werden durch Messungen der NOAA-Oberflächenflaschen weiter eingegrenzt, deren Standorte in den folgenden Abbildungen als schwarze Punkte dargestellt sind.
Abbildung (a) zeigt die vertikal integrierte Bottom-up-Schätzung für die sekundäre, d. h. chemische CO-Produktion in der Atmosphäre für September 2018, die aus dem vollständigen Chemiemodell TM5-MP stammt. Dieses Produktionsfeld wird als Teil der anfänglichen Emissionen, dem A-Priori, für unsere Inversionen verwendet. Das daraus resultierende optimierte Feld, das a posteriori, ist in Abbildung (b) dargestellt. Diese Emissionsfelder führen zu den geringsten Unterschieden zwischen den simulierten Mischungsverhältnissen und den von TROPOMI und den NOAA-Flaschen beobachteten.
Aufgrund ihrer starken Abhängigkeit von der Photochemie schwanken die sekundären CO-Produktionsraten weltweit um mehrere Größenordnungen, so dass die absoluten Zuwächse zwischen den A-posteriori- und A-priori-Emissionen schwer zu interpretieren sind (Tafel (c)). Daher zeigen wir in Abbildung (d) ihre relative Differenz, d. h. den Faktor, um den sich die Emissionen an jedem Ort verändert haben.
Im Vergleich zu den Bottom-up-Schätzungen ist in China und Indien ein starker Emissionsrückgang auf breiter Front (bis zu 75 %) zu beobachten. Diese Reduktionen können zum Teil auf politische Veränderungen in China zurückgeführt werden. Allerdings scheint die OH-Klimatologie, die wir zur Simulation des chemischen Verlusts verwenden, in dieser Region unterschätzt zu werden, was die Inversion ebenfalls in Richtung niedrigerer Emissionen verzerrt. Umgekehrt finden wir starke lokale Emissionserhöhungen über Europa und der Sahara. Dabei handelt es sich wahrscheinlich um Artefakte, die durch die begrenzten Möglichkeiten des Modells zur Erfassung der Oberflächenflaschenmessungen an diesen speziellen Stationen verursacht werden und nicht durch Satellitenbeobachtungen bestätigt werden können.
Bemerkenswert ist, dass die Mischungsverhältnisse, die unter Verwendung optimierter Emissionen aus der ausschließlich durch Satellitenbeobachtungen gesteuerten Inversion berechnet wurden, sehr gut mit den Kolbenmessungen übereinstimmen (Vergleich nicht gezeigt). Dies gilt zwar nur südlich von 55° N, könnte aber aufgrund von Modellbeschränkungen möglicherweise Inversionen in nahezu Echtzeit ermöglichen, die ausschließlich auf Satellitenbeobachtungen basieren. Diese würden dann validiert und an die Oberflächenkolben angepasst, sobald sie verfügbar sind.
Referenz:
Nüß, J. R., Daskalakis, N., Piwowarczyk, F. G., Gkouvousis, A., Schneising, O., Buchwitz, M., Kanakidou, M., Krol, M. C., Vrekoussis, M: Efficacy of high-resolution satellite observations in inverse modeling of carbon monoxide emissions, submitted to Journal of Advances in Modeling Earth Systems (JAMES), 2022
Kontakt: Rasmus Nüß (rasmus.nuess@uni-bremen.de)
November 2022:
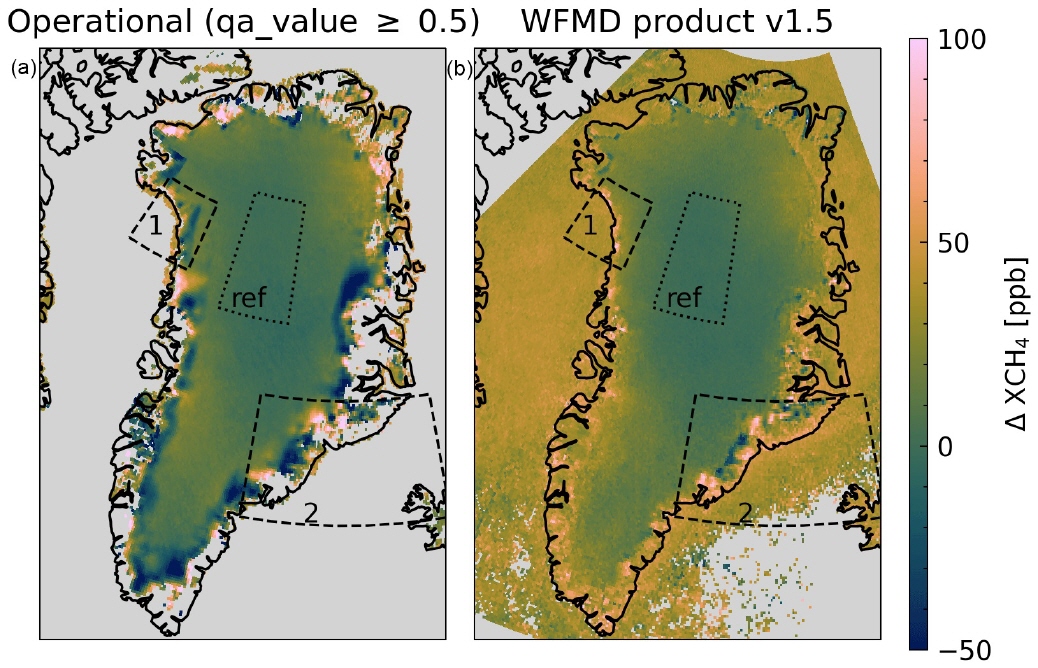
Methananomalien in Grönland
Methan (CH4) stellt nach Kohlendioxid (CO2) das zweitwichtigste Treibhausgas dar und ist etwa 28-mal stärker als CO2. Es wird durch menschliche Aktivitäten (Landwirtschaft, Abfälle, fossile Brennstoffe,...) und natürliche Prozesse freigesetzt, zum Beispiel durch biochemische Prozesse in Feuchtgebieten oder im auftauenden Permafrost.
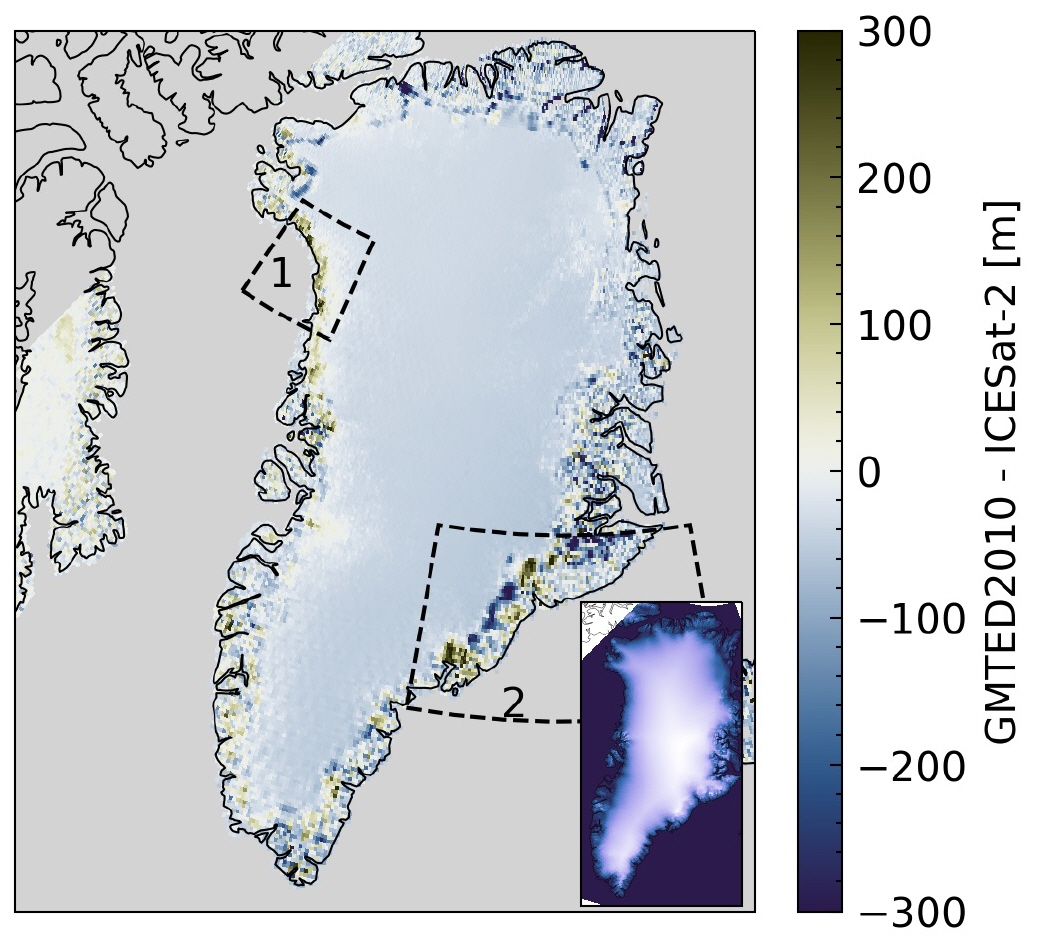
Deshalb untersuchen wir im Rahmen der Nachwuchsforschergruppe „Treibhausgase in der Arktis“ die atmosphärische Methankonzentration (XCH4) anhand von Satellitendaten. Über Grönland konnten starke Methananomalien beobachtet werden (Abb. 1a), d.h. Regionen mit sehr hohen oder niedrigen Konzentrationen. Diese Anomalien sind jedoch nicht auf Emissionen aus dem Permafrost zurückzuführen, sondern auf Ungenauigkeiten im digitalen Höhenmodell (DEM), das für die Berechnungen verwendet wurde (Abb. 2), wie unsere Forschung gezeigt hat.
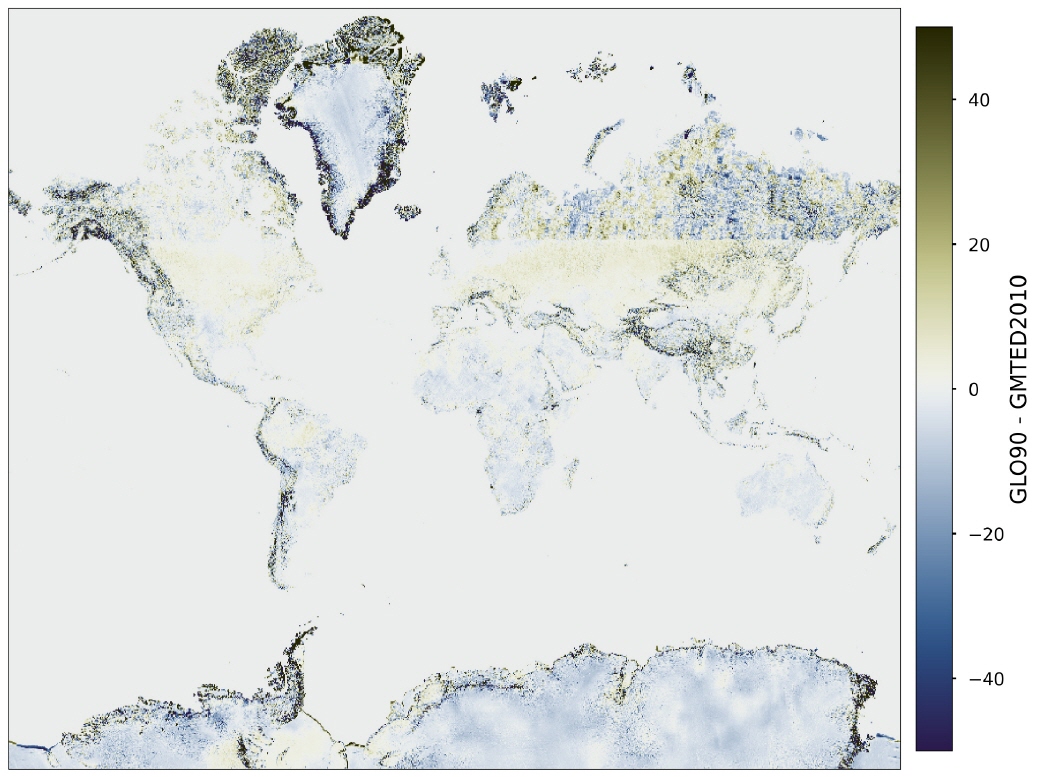
Neben Grönland weisen weitere Regionen Ungenauigkeiten in älteren DEMs auf (Abb. 3). Aufgrund dieser Erkenntnis wurde für das Methanprodukt des WFMD, das am IUP entwickelt wird, ein neueres DEM eingesetzt. Die Anomalien verschwinden in dem neuen Produkt sowohl für Grönland (Abb. 1b) als auch für die anderen Regionen, was die allgemeine Qualität des Produkts verbessert.
Referenz:
Hachmeister, J., Schneising, O., Buchwitz, M., Lorente, A., Borsdorff, T., Burrows, J. P., Notholt, J., and Buschmann, M.: On the influence of underlying elevation data on Sentinel-5 Precursor TROPOMI satellite methane retrievals over Greenland, Atmos. Meas. Tech., 15, 4063–4074, https://doi.org/10.5194/amt-15-4063-2022, 2022.
Kontakt:
jonas_h@iup.physik.uni-bremen.de
Oktober 2022:
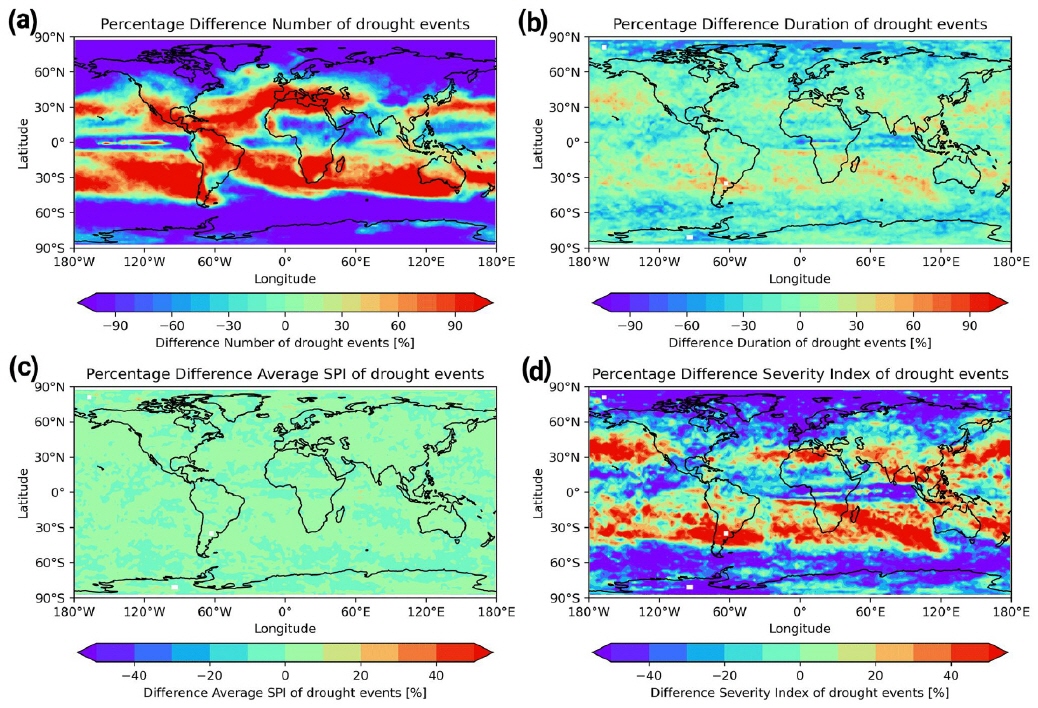
Zukünftige Veränderungen von Dürren im CMIP5-Ensemble, analysiert mit dem Earth System Model Evaluation Tool (ESMValTool)
Motiviert durch den trockenen Sommer dieses Jahres zeigt unser Bild des Monats zukünftige Veränderungen in Anzahl, Dauer, durchschnittlichem „standard precipitation index“ (SPI) und Schweregrad von Dürren, berechnet auf Grundlage des RCP8.5-Zukunftsszenario mit Klimamodellen des Coupled Model Intercomparison Project Phase 5 (CMIP5). Der SPI beschreibt lokale Niederschlagsanomalien und kann verwendet werden, um meteorologische Dürren zu identifizieren. Bis zum Ende des 21. Jahrhunderts zeigen die Projektionen eine Zunahme der Anzahl, Dauer und Schwere von Dürren vor allem in den schon heute trockenen, subtropischen Gebieten. Für Dürreindizes, die zusätzlich zum Niederschlag die potenzielle Evapotranspiration berücksichtigen, wie der Standardized Precipitation Evapotranspiration Index (SPEI), oder die auf der Berechnung der Wasserbilanz beruhen, wie der skalierte Palmer Drought Severity Index (SC-PDSI), wird für die meisten Teile der Welt eine Verschiebung hin zu häufigeren Dürren festgestellt, siehe z. B. Ruhe (2022).
Das Diagnose-Tool zur Erstellung dieser Abbildung gehört zum Earth System Model Evaluation Tool (ESMValTool), einem Community-Diagnose- und Leistungsmetrik-Tool, das zur Verbesserung der umfassenden und routinemäßigen Auswertung von Erdsystemmodellen (ESMs) entwickelt wurde. Um eine effiziente und benutzerfreundliche Datenverarbeitung zu ermöglichen enthält es einen hochgradig optimierten, in Python geschriebenen Präprozessor (Righi et al. 2020) zur Bereitstellung von Standardoperationen für Eingabedaten, wie z. B. die Interpolation auf verschiedene Gitter oder die Berechnung von Statistiken für mehrere Modelle. Mit dem ESMValTool wird eine große Anzahl von Diagnose-Tools zur Verfügung gestellt, die eine quasi-operationelle und umfassende Bewertung von ESMs erlauben, inklusive der Berechnung und Darstellung von Mittelwert, Trend und Variabilität für atmosphärische, ozeanische und terrestrische Variablen (Eyring et al. 2020), sowie Diagnose-Tool für „emergent constraints“ und die Analyse zukünftiger Projektionen von ESMs in CMIP (Lauer et al. 2020). Unser Bild des Monats ist das Ergebnis eines ESMValTool-Rezepts (recipe_martin18grl.yml), das in der Version 2.0 des ESMValTools implementiert und in Weigel et al. (2020) veröffentlicht wurde und Diagnose-Tools für Extremereignisse, Klimafolgen und regionale Auswertungen zusammenfasst.
Literatur:
Eyring, V., Bock, L., Lauer, A., Righi, M., Schlund, M., Andela, B., Arnone, E., Bellprat, O., Brötz, B., Caron, L.-P., Carvalhais, N., Cionni, I., Cortesi, N., Crezee, B., Davin, E.L., Davini, P., Debeire, K., de Mora, L., Deser, C., Docquier, D., Earnshaw, P., Ehbrecht, C., Gier, B.K., Gonzalez-Reviriego, N., Goodman, P., Hagemann, S., Hardiman, S., Hassler, B., Hunter, A., Kadow, C., Kindermann, S., Koirala, S., Koldunov, N., Lejeune, Q., Lembo, V., Lovato, T., Lucarini, V., Massonnet, F., Müller, B., Pandde, A., Pérez-Zanón, N., Phillips, A., Predoi, V., Russell, J., Sellar, A., Serva, F., Stacke, T., Swaminathan, R., Torralba, V., Vegas-Regidor, J., von Hardenberg, J., Weigel, K., & Zimmermann, K.: Earth System Model Evaluation Tool (ESMValTool) v2.0 – an extended set of large-scale diagnostics for quasi-operational and comprehensive evaluation of Earth system models in CMIP. Geoscientific Model Development, 13, 3383-3438, 2020.
Lauer, A., Eyring, V., Bellprat, O., Bock, L., Gier, B.K., Hunter, A., Lorenz, R., Pérez-Zanón, N., Righi, M., Schlund, M., Senftleben, D., Weigel, K., & Zechlau, S.: Earth System Model Evaluation Tool (ESMValTool) v2.0 – diagnostics for emergent constraints and future projections from Earth system models in CMIP. Geoscientific Model Development, 13, 4205-4228, 2020.
Righi, M., Andela, B., Eyring, V., Lauer, A., Predoi, V., Schlund, M., Vegas-Regidor, J., Bock, L., Brötz, B., de Mora, L., Diblen, F., Dreyer, L., Drost, N., Earnshaw, P., Hassler, B., Koldunov, N., Little, B., Loosveldt Tomas, S., & Zimmermann, K.: Earth System Model Evaluation Tool (ESMValTool) v2.0 – technical overview. Geosci. Model Dev., 13, 1179-1199, 2020.
Ruhe, L.: A Comparison of Drought Indices in CMIP6 Climate Projections, M.Sc. Thesis, University of Bremen, Bremen, Germany, https://www.iup.uni-bremen.de/PEP_master_thesis/thesis_2022/Ruhe_MScThesis_2022.pdf, 2022.
Weigel, K., Bock, L., Gier, B. K., Lauer, A., Righi, M., Schlund, M., Adeniyi, K., Andela, B., Arnone, E., Berg, P., Caron, L.-P., Cionni, I., Corti, S., Drost, N., Hunter, A., Lledó, L., Mohr, C. W., Paçal, A., Pérez-Zanón, N., Predoi, V., Sandstad, M., Sillmann, J., Sterl, A., Vegas-Regidor, J., von Hardenberg, J., and Eyring, V.: Earth System Model Evaluation Tool (ESMValTool) v2.0 – diagnostics for extreme events, regional and impact evaluation, and analysis of Earth system models in CMIP, Geosci. Model Dev., 14, 3159–3184, https://doi.org/10.5194/gmd-14-3159-2021, 2021.
Links
ESMValTool Website: https://www.esmvaltool.org/
Software: https://github.com/ESMValGroup/ESMValTool
Dokumentation: https://docs.esmvaltool.org/
Tutorial: https://esmvalgroup.github.io/ESMValTool_Tutorial
September 2022:
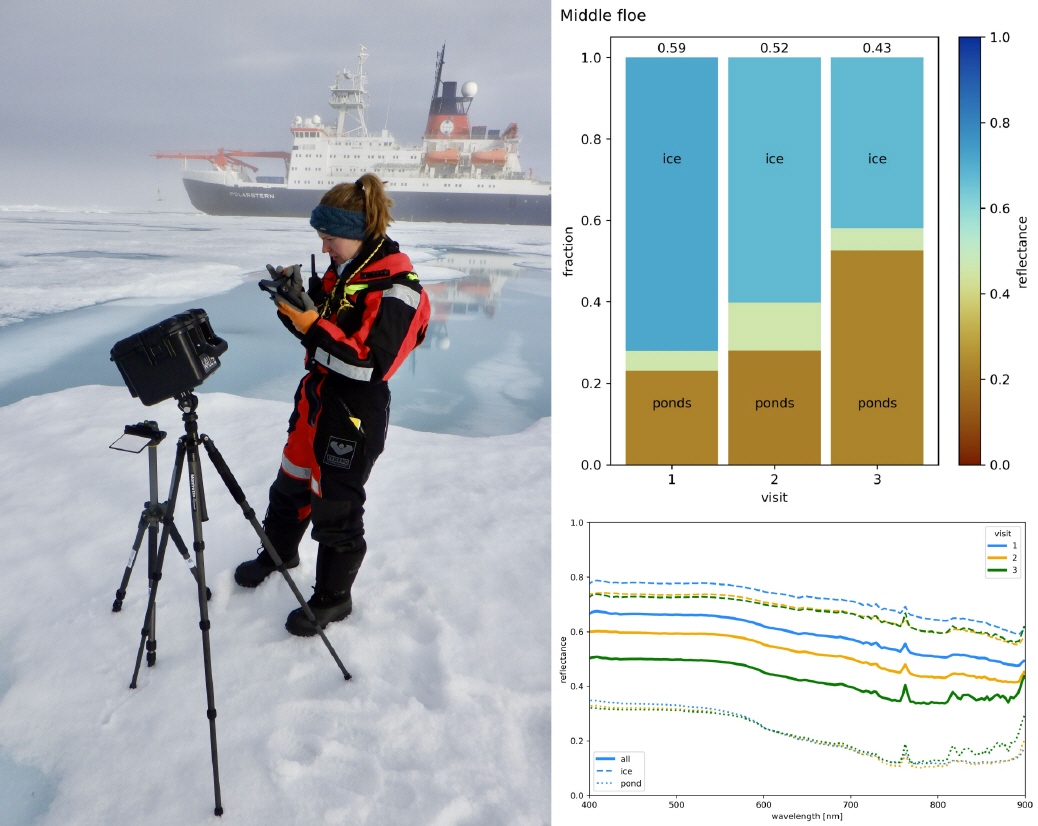
Im arktischen Sommer entstehen Schmelzwassertümpel auf dem Meereis. Sie verringern maßgeblich das Reflexionsvermögen und Albedo der Oberfläche und erhöhen damit die Absorption einfallender Sonnenstrahlung. Dies ist ein selbstverstärkender Prozess und wird auch Eis-Albedo-Rückkopplung genannt. Er spielt eine grundlegende Rolle für die verstärkte Erwärmung der Arktis im Vergleich zu unseren mittleren Breiten.
Die Arbeitsgruppe "Fernerkundung der Polarregionen" am IUP arbeitet an einem Verfahren, mit dem aus optischen Satellitendaten die Oberflächenalbedo und der von Schmelztümpeln bedeckte Flächenanteil bestimmt werden kann (https://seaice.uni-bremen.de/melt-ponds/). In den letzten zwei Monaten waren wir auf einer FS Polarstern-Expedition in der Arktis unterwegs (https://follow-polarstern.awi.de), um dort neue in-situ Messungen zu sammeln, die jetzt genutzt werden, um das Vorwärtsmodell für die Satellitenbeobachtungen zu verbessern. Mit einer Hyperspektralkamera, WALL-E genannt, wurden spektral hoch aufgelöste Messungen der von Schmelztümpeln und Meereis reflektierten Strahlung durchgeführt, um deren Variabilität und Entwicklung zu untersuchen. Die räumliche Ausdehnung der Messungen ermöglicht zusätzlich eine Einschätzung des Oberflächenanteils der von Schmelztümpeln bedeckt ist. Um die entscheidenden Faktoren für die zeitliche Änderung der Albedo zu ermitteln, wurden die Messungen auf denselben Eisschollen drei Mal zwischen dem 15. und 31. Juli 2022 wiederholt (in der Abbildung „visit“ 1 bis 3).
In diesem Zeitraum wurde die Eisscholle "dunkler" (von 0.59 zu 0.43 Reflexionsgrad), was hauptsächlich auf einen Anstieg der Schmelztümpelbedeckung aber auch eine Verringerung des Reflexionsgrads des Eises zurückzuführen ist (Balkendiagramm oben rechts in der Abbildung).
Kontakt:
Dr. Gunnar Spreen(gunnar.spreen@uni-bremen.de)
Hannah Niehaus (niehaus@uni-bremen.de)
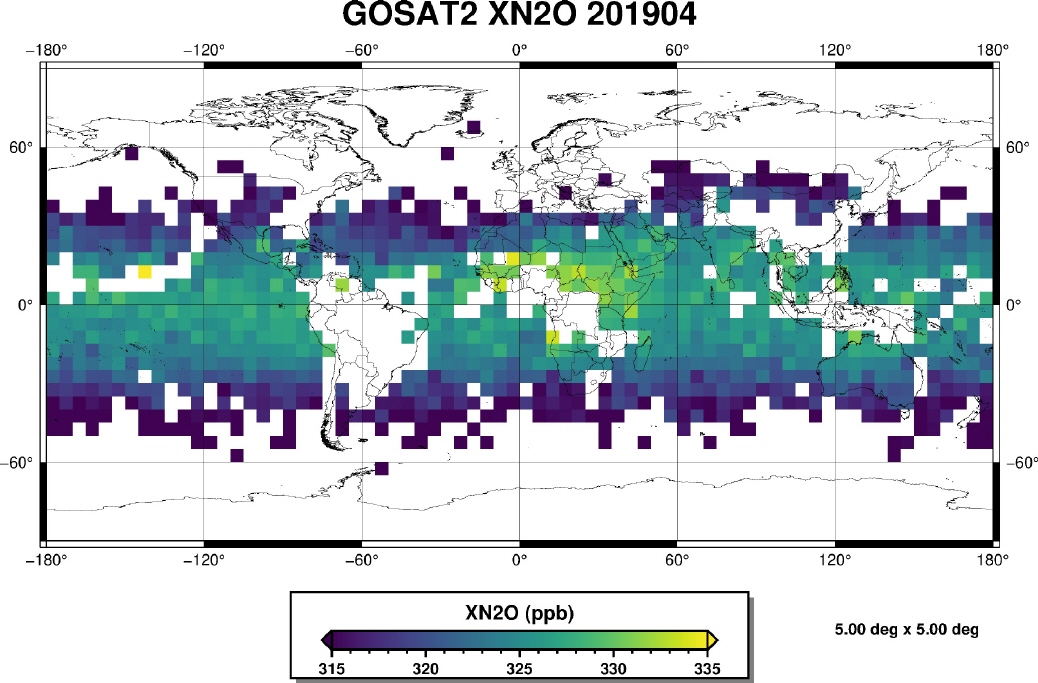
Globale N2O Karten aus GOSAT-2 Satellitendaten
Stickstoffdioxid (N2O), auch als Lachgas bekannt, ist nach Kohlendioxid (CO2) und Methan (CH4) das wichtigste anthropogene Treibhausgas. N2O wird vorwiegend durch natürliche Prozesse (z.B. durch Bakterien) erzeugt, es wird aber auch in der Landwirtschaft (Einsatz von Düngemitteln) sowie bei der Verbrennung von Biomasse freigesetzt. Die Konzentration von N2O in der Atmosphäre ist etwa 1000-mal kleiner als die von CO2, aber das Treibhauspotential von N2O ist fast 300-mal größer, wodurch N2O bedeutsam zum Klimawandel beiträgt.
Es gibt allerdings nur wenige globale Messungen von N2O, speziell durch Satelliten. Die im Bild dargestellte Karte (aus Noël et. al, 2022) zeigt die atmosphärische Verteilung von XN2O (d.h. die mittlere trockene Gesamtsäule von N2O) für April 2019, die am IUP aus Messungen des japanischen GOSAT-2 Satelliten bestimmt wurden.
Wie man darin sieht, sind die Gesamtsäulen von N2O in den Tropen größer als in höheren Breiten. Das liegt daran, dass das meiste N2O in der unteren Atmosphäre, der Troposphäre, erzeugt wird und vorhanden ist und die Troposphäre in den Tropen in größere Höhen reicht.
Referenz:
Noël et al., Retrieval of greenhouse gases from GOSAT and GOSAT-2 using the FOCAL algorithm, Atmos. Meas. Tech., 15(11), 3401–3437, 2022, doi: rm10.5194/amt-15-3401-2022.
https://amt.copernicus.org/articles/15/3401/2022/
Kontakt:
Stefan Noël (stefan.noel@iup.physik.uni-bremen.de)
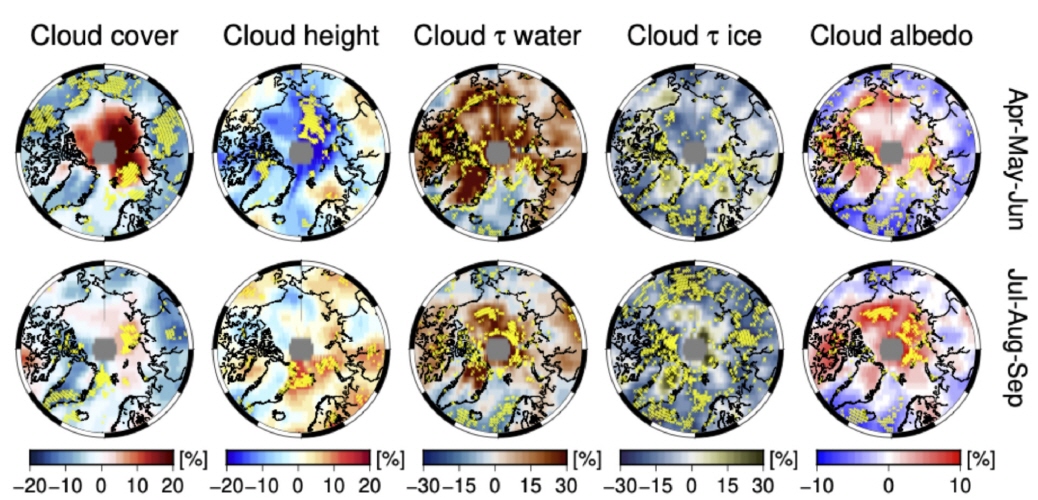
Eine jüngst von der IUP Gruppe " Cloud Aerosol Surface PArameter Retrieval" im Rahmen des Transregios (AC)⊃3; durchgeführte Studie untersucht die Wolken, ihre Eigenschaften und die Größe des Strahlungseffektes von Wolken in der Arktis auf der Basis von Satellitendaten.
Arktische Wolken sind ein wichtiger Faktor in der Beeinflussung des arktischen Klimas. Sie wirken dabei sowohl erwärmend als auch abkühlend. Die Gründe wann sie erwärmend oder abkühlend wirken hängen von verschiedenen Bedingungen ab. Hierzu gehören die mikrophysikalischen Eigenschaften der Wolken, die Beleuchtung, die thermodynamische Phase der Wolken (also bis zu welchem Grad sie flüssig oder gefrorenes Wasser beinhalten) und die Reflektivität des Bodens.
Wenngleich bei der Betrachtung über die gesamte Arktis der Bewölkungsgrad sich nicht nennenswert über die Zeit verändert hat, so haben dies einige Wolkeneigenschaften sehr wohl. So z.B. die optische Dicke von Flüssigwasserwolken und der von reinen Eiswolken. Auffällig ist auch teilweise deutliche Veränderung der Wolkenhelligkeit (Cloud albedo).
Referenz:
The aerosol, cloud and surface property group "Pan-Arctic and regional trends of reflectance, clouds and fluxes: implications for Arctic Amplification" (2022)
Kontakt:
Marco Vountas vountas@iup.physik.uni-bremen.de
or Luca Lelli luca@iup.physik.uni-bremen.de
https://www.iup.uni-bremen.de/aerosol
Juni 2022:
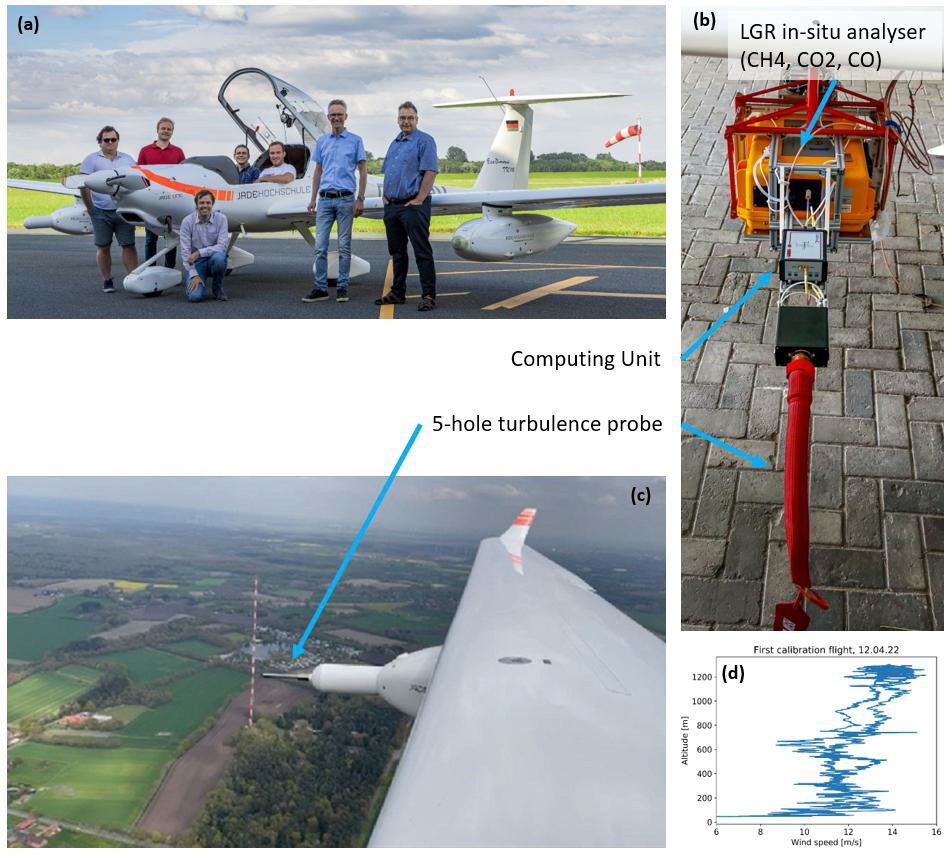
Neues Messsystem zur Verbesserung der Beobachtung von Treibhausgasen aus Flugzeugen,
Universität Bremen, Institut für Umweltphysik
Die Wissenschaftler am Institut für Umweltphysik sind auf die Entwicklung und den Einsatz verschiedener Arten von Flugsensoren spezialisiert, mit denen die Emissionen anthropogener Treibhausgase durch Messung der atmosphärischen Verteilungen von Methan (CH4) und Kohlendioxid (CO2) lokalisiert und quantifiziert werden können. Zur genauen Schätzung der Emissionen aus diesen Verteilungen ist eine genaue Kenntnis des lokalen Windfelds erforderlich. Daher wurde im Frühjahr 2022 eine neu angeschaffte 5-Loch-Turbulenzsonde zusammen mit einem in-situ-Treibhausgasanalysator erfolgreich in eine der Flügelgondeln des Motorseglers der Jade Hochschule Wilhelmshaven eingebaut. Der Diamond HK36TTC-ECO ist eine flexible Plattform für verschiedene Fernerkundungsaufgaben, da er keinen Zertifizierungsprozess zur Installation von Sensoren benötigt.
Erste Testflüge in Zusammenarbeit mit der Jade Hochschule Wilhelmshaven wurden in Norddeutschland erfolgreich durchgeführt, um das neue Instrument zu kalibrieren. Zusätzlich wurden Vorbeiflüge an dem vom Deutschen Wetterdienst (DWD) betriebenen ICOS-Messturm in Steinkimmen/Ganderkesee durchgeführt, der das vertikale Windprofil in 5 verschiedenen Höhen bis zu einer Höhe von 250m beobachtet. Diese Messungen werden zu Vergleichszwecken herangezogen und sollen die Kalibrierungsqualität der Windsonde weiter verbessern.
Weitere Kalibrierungsflüge, bei denen Messungen aus der Luft, LIDAR-, Drohnen- und Turmmessungen verglichen werden, sind geplant.
Kontakt: heinrich.bovensmann@uni-bremen.de
Mai 2022:
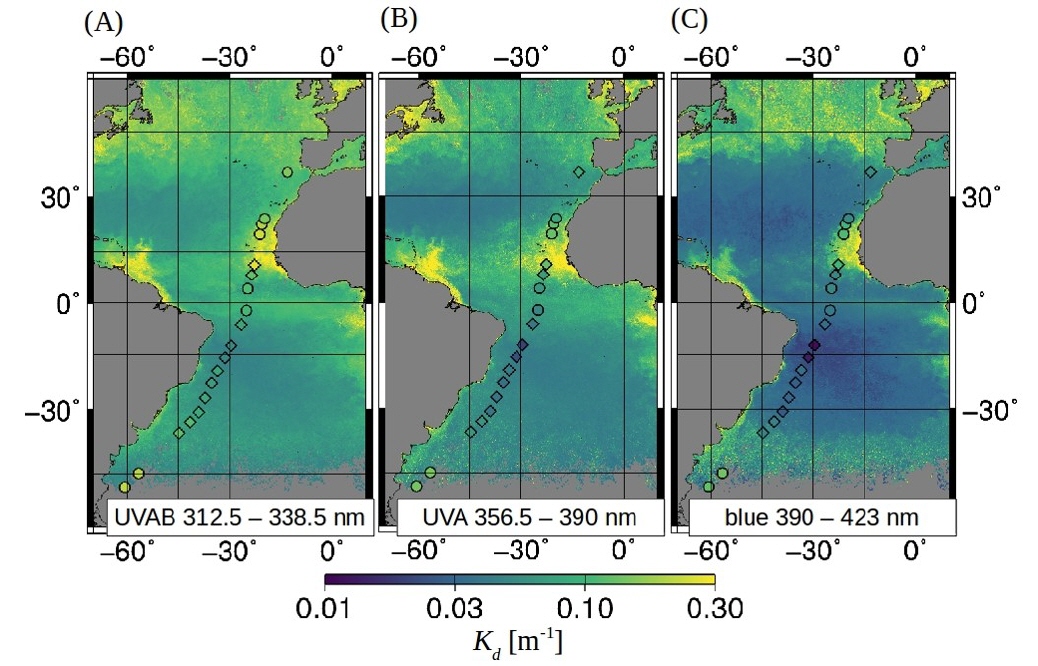
TROPOMI-retrieved underwater light attenuation in three spectral regions in the ultraviolet to blue.
Frontiers in Marine Science 9: 787992. doi:10.3389/fmars.2022.787992
Das Sonnenlicht spielt eine wichtige Rolle für biologische, chemische und physikalische Prozesse im Ozean. Hochenergetische ultraviolette (UV) Strahlung kann schädliche und nützliche Auswirkungen auf Wasserorganismen haben, und ihre Wechselwirkung mit dem Ozean ist im Allgemeinen komplex. Die meisten Prozesse werden durch die Klimaerwärmung beeinflusst. Satellitengestützte Beobachtungen des Lichteinfalls in den Ozean in Kombination mit Modellierung werden verwendet, um diese Prozesse zu verstehen und Vorhersagen für den zukünftigen Ozean und Klimaszenarien im Allgemeinen zu treffen. Herkömmliche Satelliten-Farbsensoren für den Ozean messen nicht den ultravioletten Bereich. Informationen über das Eindringen von UV-Licht werden nur indirekt aus Messungen im sichtbaren Wellenlängenbereich abgeleitet, was natürlich mit größeren Unsicherheiten verbunden ist.
In dieser Studie wurden rückgestreute UV- bis Blaulichtdaten mit einer kontinuierlichen spektralen Auflösung von 0,5 nm des TROPOMI-Sensors an Bord des Sentinel-5-Precursor-Satelliten verwendet. Wir stellen die ersten direkten satellitengestützten Beobachtungen des Eindringens von Kurzwellen in den Ozean vor, und zwar in Form der diffusen Dämpfung (Kd) vom ultravioletten bis zum blauen Spektralbereich. Unser Ansatz basiert auf differentieller optischer Absorptionsspektroskopie, um das Signal der Vibrations-Raman-Streuung (VRS) zu ermitteln, und wird dann mit einer gekoppelten Ozean-Atmosphären-Strahlungstransfermodellierung (RTM) kombiniert, um Kd im UV-Bereich (312,5-338,5 nm und 356,5-390 nm) und zusätzlich zum blauen Kd (390-423 nm) abzuleiten. Das VRS-Signal wird in den TROPOMI-Messungen gut erkannt (Anpassungsfehler <15 %), und die TROPOMI-Kd-Werte zeigen eine geringe Empfindlichkeit gegenüber der Parametrisierung von ozeanischen und atmosphärischen Effekten und eine gute Übereinstimmung mit den in situ-Kd-Werten, die aus in situ gemessenen Unterwasser-Lichtspektren stammen.
Diese Produkte haben ein hohes Potenzial, die Bedürfnisse der Nutzer in der Modellierungsgemeinschaft zu befriedigen, die spektrale Informationen über die kurzwellige Lichtdurchdringung zur Verbesserung der Schätzungen des Wärmehaushalts des Ozeans, der Primärproduktivität, der photochemischen Reaktionsraten von klimatisch wichtigen Verbindungen und der UV-Dosisraten als Indikator für schädliche Auswirkungen auf aquatische Organismen benötigen.
April 2022:
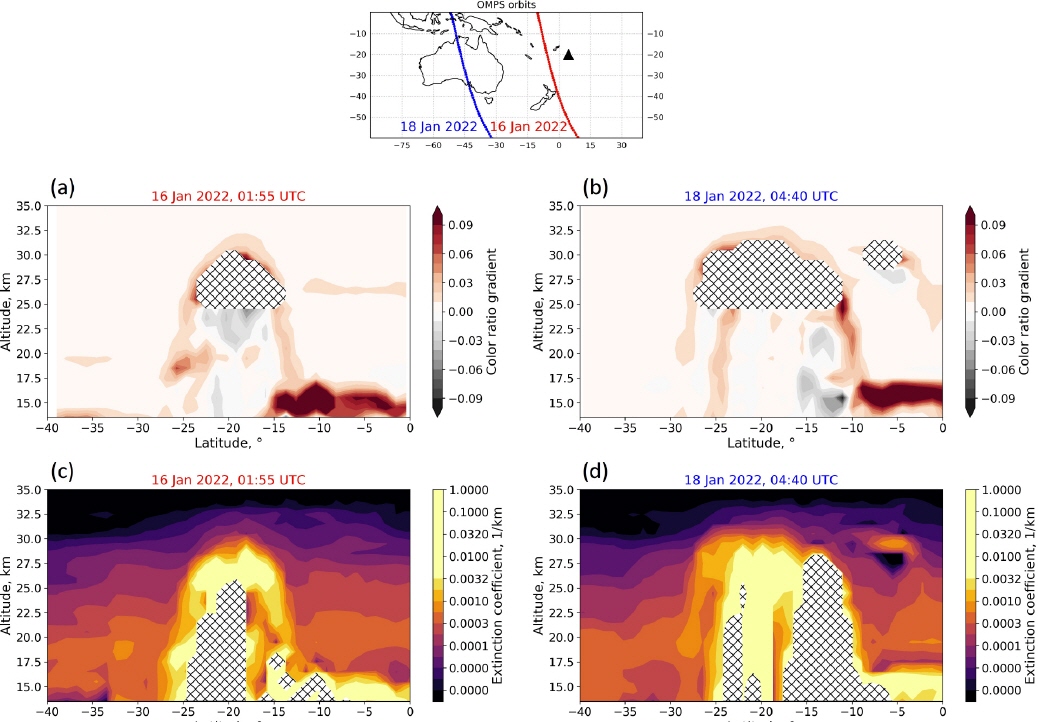
Ausbruch des Hunga Tonga-Hunga Ha'apai
Am 15. Januar 2022 stieß der Untervulkan Hunga Tonga-Hunga Ha'apai (20,55°S, 175,40°W) Material aus Gas, Dampf und Asche bis zu einer Höhe von 58 km aus. Diese Höhe der Aschewolke ist außergewöhnlich und die höchste, die seit Satellitenbeobachtungen bekannt ist. Selbst der zweitgrößte Vulkanausbruch des Mount Pinatubo auf den Philippinen im Jahr 1991 erreichte „nur“ eine Höhe von 35 km. Vermutlich treibt die Kombination aus vulkanischer Hitze und überhitzter Feuchtigkeit aus dem Ozean die Aerosole in solch ungeahnte Höhen.
Der oberste Teil der Wolke sublimierte aufgrund der extremen Trockenheit in der Mesosphäre schnell. In etwa 30 km Höhe bildete die Vulkanfahne einen ausgedehnten Schirm, der von den starken stratosphärischen Winden nach Westen getragen wurde. Wie aus der Abbildung ersichtlich ist, stieg dieser Schirm auf und dehnte sich aufgrund von thermischem Auftrieb und Dispersion aus. Innerhalb von zwei Wochen umrundete er den Globus. Die vulkanischen Aerosole verbleiben lange Zeit in der Stratosphäre, haben aber keine nennenswerten Auswirkungen auf das globale Klima. Dafür war der eingebrachte Aerosolgehalt von 0,4 Teragramm Schwefeldioxid zu gering. Zum Vergleich: Der Mount Pinatubo emittierte etwa 18,5 Teragramm Schwefeldioxid in die Stratosphäre und senkte die globale Temperatur vorübergehend um etwa 0,6°C.
Referenzen:
Malinina, E., Rozanov, A., Niemeier, U., Wallis, S., Arosio, C., Wrana, F., Timmreck, C., von Savigny, C., and Burrows, J. P.: Changes in stratospheric aerosol extinction coefficient after the 2018 Ambae eruption as seen by OMPS-LP and MAECHAM5-HAM, Atmos. Chem. Phys., 21, 14871–14891, https://doi.org/10.5194/acp-21-14871-2021, 2021.
https://earthobservatory.nasa.gov
März 2022:
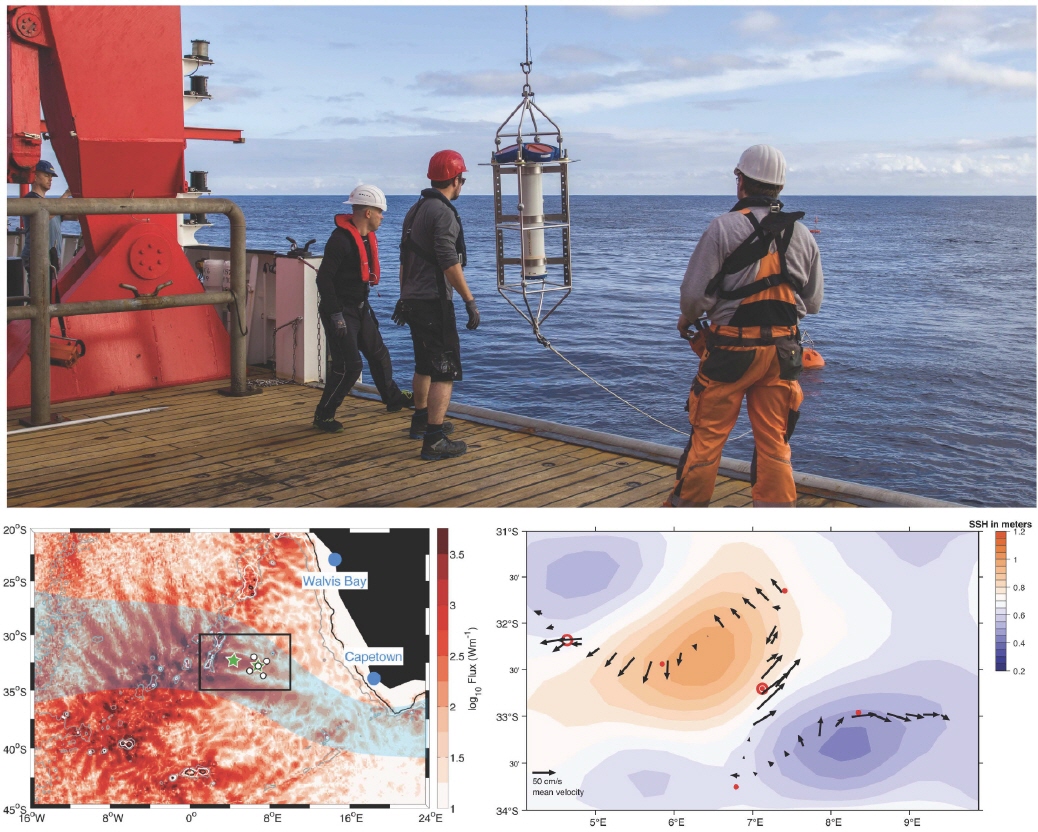
Forschungsfahrt in den Südatlantik
Die Expedition 283 des Forschungsschiffs SONNE, die im Frühjahr 2021 durchgeführt wurde, war etwas Besonderes. Aufgrund der Corona-Pandemie waren viele Forschungsfahrten abgesagt worden, und nun mussten mehrere ozeanographische Verankerungen im Südatlantik geborgen und neue Instrumente eingesetzt werden. Wissenschaftler*innen und Studierende aus vier Instituten begaben sich auf die lange Reise, die aus Gründen des Infektionsschutzes in Emden begann und dort nach 64 Tagen auf See und mehr als 17.000 Seemeilen auch wieder endete. Unsere Gruppe vom IUP setzte zwei tiefe Verankerungen mit Strommessern und Thermistoren sowie 5 Inverted Echo Sounder aus, die Teil des Beobachtungsprogramms des Sonderforschungsbereichs TRR 181 "Energietransfers in Atmosphäre und Ozean" sind (www.trr-energytransfers.de).
Ziel des Experiments ist es, monatelange Zeitreihen von Strömungsgeschwindigkeiten und Temperaturen zu erhalten, um Wechselwirkungen zu untersuchen, zwischen internen Schwerewellen, die vom Walvis-Rücken ausgehen, und Agulhas-Wirbeln, die sich von Südafrika in den Südatlantik ausbreiten. Diese Wechselwirkungen zwischen Wellen und Wirbeln und ihr Austausch von kinetischer Energie sind noch nicht vollständig verstanden. Gezeitenströmungen an Seamounts und Kontinentalabhängen beispielsweise regen interne Schwerewellen an, die Hunderte von Kilometern über Ozeanbecken hinweg wandern können, bevor sie schließlich zur turbulenten Vermischung in der Wassersäule beitragen. Ihr Energieverlust wird durch eine Reihe von Prozessen und Wechselwirkungen bestimmt. In unserem Projekt untersuchen wir die Streuung und Brechung der Gezeitenwellen im Inneren der Ozeane mit dem Ziel, diese Prozesse besser in Klimamodelle zu integrieren.
Februar 2022:
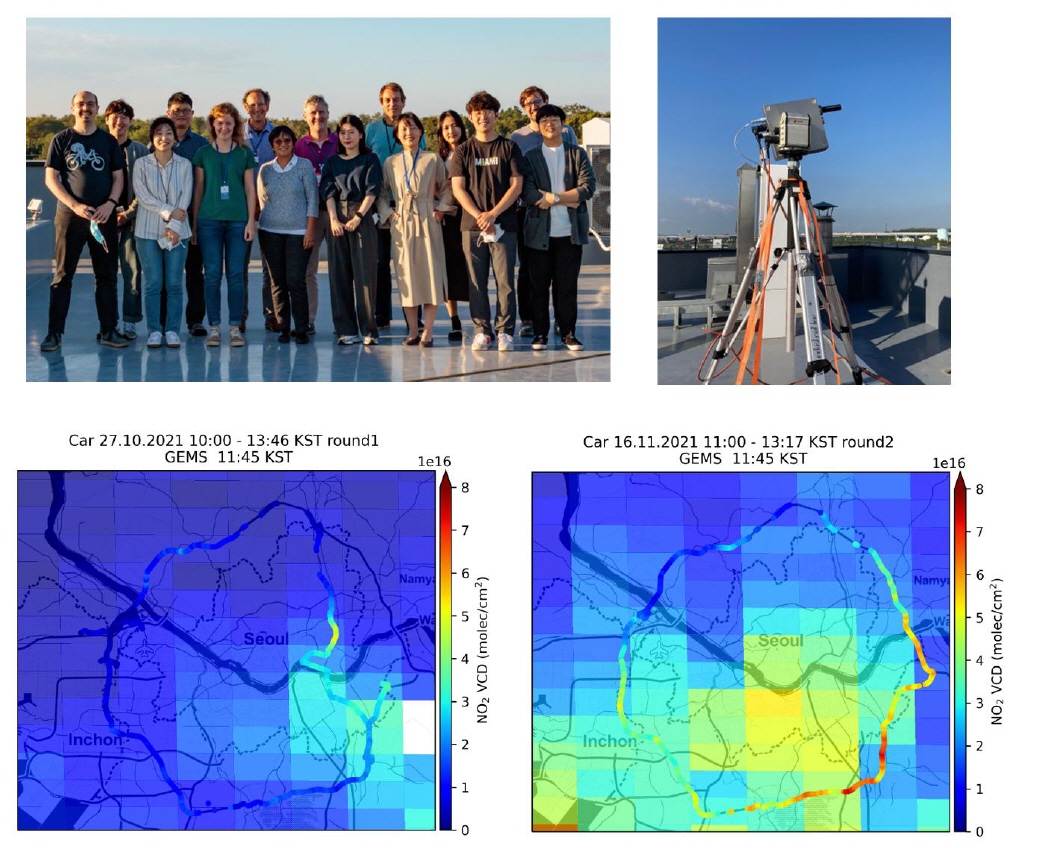
Die GMAP-2021-Kampagne
Im Oktober und November 2021 nahm das IUP Bremen an der GMAP-2021-Kampagne (GEMS Map of Air Pollution) in Südkorea teil. Diese Kampagne brachte Instrumente aus Südkorea, den USA, Belgien, den Niederlanden und Deutschland zusammen, um Daten über die Luftverschmutzung in Südkorea für die Validierung des Satelliteninstruments GEMS (Geostationary Environment Monitoring Spectrometer) zu sammeln. GEMS ist das erste geostationäre Satelliteninstrument zur Überwachung der Luftqualität, das von der südkoreanischen Raumfahrtbehörde im Februar 2020 gestartet wird und stündlich Messungen der wichtigsten Schadstoffe über Asien liefert. Ähnliche Instrumente werden in den kommenden Jahren von den USA (TEMPO) und Europa (Sentinel-4) gestartet.
Während der GMAP-Kampagne installierte das IUP Bremen auf dem Dach des NIER-Gebäudes (National Institute of Environmental Research) in Incheon ein MAX-DOAS-Instrument mit mehreren Azimuten. Dieses Instrument liefert Daten über die Häufigkeit von NO2, HCHO, SO2 und anderen Schadstoffen, die für die langfristige Validierung der GEMS-Messungen wichtig sind. Es wird auch in den kommenden Monaten an diesem Standort in Betrieb sein. Ähnliche Instrumente wurden von anderen Gruppen im Großraum Seoul und anderen Teilen Südkoreas eingesetzt und sollen zur Charakterisierung und Verbesserung der Satellitendatenprodukte beitragen.
Zusätzlich zu den stationären Messungen wurde eine große Anzahl mobiler DOAS-Messungen von Fahrzeugen aus durchgeführt, um die räumliche Variabilität von NO2 zu untersuchen, zeitliche Veränderungen zu überwachen und die NOx-Emissionen von Seoul zu schätzen. Die Beobachtungen zeigen eine große Variabilität von NO2 innerhalb einzelner GEMS-Satellitenpixel, rasche Veränderungen im Laufe der Zeit und den Einfluss sowohl lokaler Emissionen als auch des Transports auf die beobachteten NO2-Säulenmengen. Diese Daten werden durch In-situ- und Fernerkundungsbeobachtungen aus mehreren Flugzeugüberflügen über demselben Gebiet ergänzt.
Weitere Informationen:
Jhoon Kim et al., New Era of Air Quality Monitoring from Space: Geostationary Environment Monitoring Spectrometer (GEMS), BAMS, 2020, DOI: https://doi.org/10.1175/BAMS-D-18-0013.1
Januar 2022:
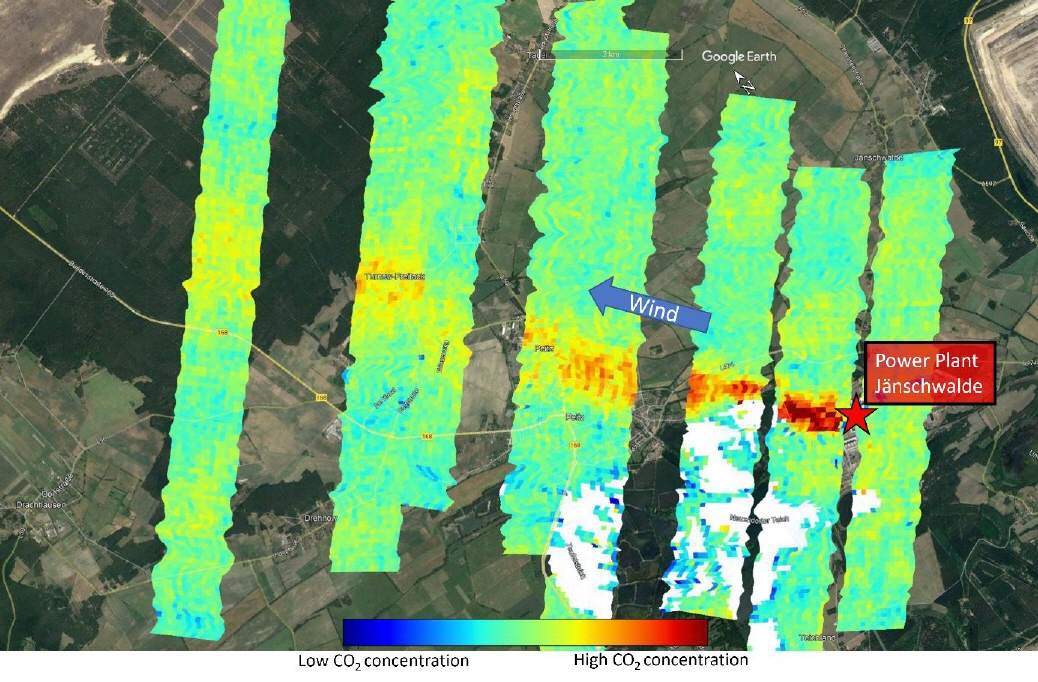
Wissenschaftler des Instituts für Umweltphysik entwickeln neue optische Sensoren, um die Verteilung von Methan (CH4) und CO2 in der Atmosphäre von Flugzeugen aus abzubilden, ähnlich wie künftige Satelliten, aber mit höherer Empfindlichkeit für punktuelle Emissionen. Der Prototyp des abbildenden Besen-Spektrometers - genannt MAMAP2D-Light - wurde erfolgreich in den Flügeln des Motorseglers der Jade Hochschule Wilhelmshaven montiert (siehe IUP-Bild des Monats Juni 2021) und absolvierte erfolgreich seinen ersten Flug über dem Kraftwerk Jänschwalde bei Cottbus, Deutschland.
Die anschließende Datenanalyse ergab das oben gezeigte Bild, auf dem die CO2-Fahne des Kraftwerks Jänschwalde deutlich in rötlichen Farben zu erkennen ist. Die aus diesem Datensatz geschätzten Emissionen stimmen innerhalb des Unsicherheitsbereichs mit den durchschnittlichen Emissionen in der Woche des Überflugs überein, und die Ergebnisse sowie weitere Leistungsmerkmale wurden auf der Herbsttagung der American Geophysical Union im Dezember 2021 vorgestellt (1). Im Sommer 2022 wird dieses Instrument an Bord des deutschen Höhenforschungsflugzeugs HALO im Rahmen der internationalen COMET 2.0-Kampagne geflogen, die auf die CH4- und CO2-Emissionen in hohen Breitengraden aus Feuchtgebieten sowie aus geologischen Quellen und der Öl-/Gasproduktion in Kanada abzielt.
Kontakt: heinrich.bovensmann@uni-bremen.de
(1) Jakob Borchardt, Konstantin Gerilowski, Sven Krautwurst, Wilke Thomssen, Jan Franke, Martin Kumm, Pascal Janßen, Jens Wellhausen, Heinrich Bovensmann, John P. Burrows(2021), The New Imaging Spectrometer MAMAP2D-Light– Initial Calibration and First Measurement Results, [A25G-1759] presented at 2021 Fall Meeting, AGU, 13-17 Dec.,
https://agu2021fallmeeting-agu.ipostersessions.com/default.aspx?s=65-03-4F-E7-23-6B-ED-73-35-C6-6C-C5-C7-C1-9E-A9


